Figures & data
Table 1 List of genes and primer sequences
Figure 1 Preparation of the PLGA/GO composite and its application for wound treatment.
Abbreviations: ES, electrical stimulation; St, Staphylococcus aureus; Es, Escherichia coli.
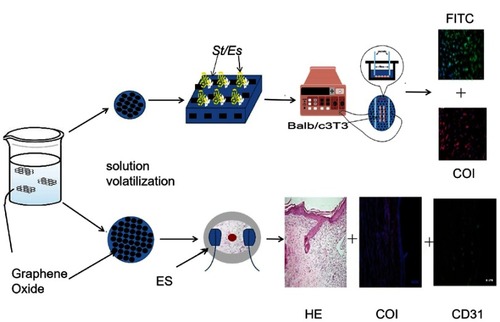
Figure 2 Characteristics of the PLGA/GO composites. (A) Water contact angle and (B) tensile strength of the PLGA incorporated with different concentrations of GO. (a) PLGA, (b) PLGA/GO composites (0.5%), (c) PLGA/GO composites (1 wt%), (d) PLGA/GO composites (2 wt%), and (e) PLGA/GO composites (5 wt%). *P<0.05 (n=3).(C) Photographs of bacterial colonies formed by E. coli and S. aureus cells treated with (a) PLGA, (b) PLGA/GO composites (0.5%), (c) PLGA/GO composites (1 wt%), (d) PLGA/GO composites (2 wt%), and (e) PLGA/GO composites (5 wt%). (D) Loss of E. coli and (C) S. aureus cell viability. *P<0.05 (n=3).
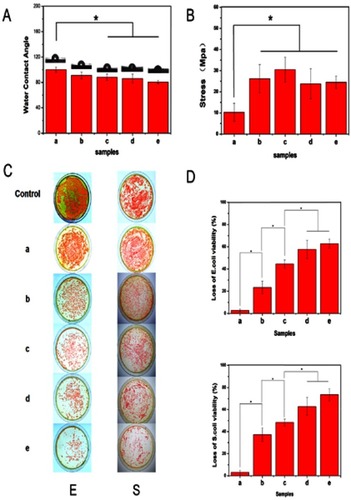
Figure 3 3.1. PLGA/GO-mediated changes in morphology. (A) Cell viability according to MTT assay (absorbance at 540 nm) at each time point and under different culture conditions. *P<0.05 (n=3). (B) Morphology of Balb/c3T3 cells cultured under different conditions for 3 days. Staining of the cytoskeleton (green) and nucleus (blue). Scale bars, 100 μm. 3.2. qRT-PCR analysis of genes related to tissue repair. (A) Measurement of VEGF and COL-1 levels following Balb/c3T3 cell culture for 7 days under different conditions. (a) PLGA biofilm, (b) PLGA/GO composites (2 wt%), (c) ES, and (d) PLGA/GO composites (2 wt%) + ES (n=4 replicates). *P<0.05 (n=4) (B) Immunofluorescence images of COL-1 protein under different culture conditions. (a) PLGA biofilm, (b) PLGA/GO composites (2 wt%), (c) ES, and (d) PLGA/GO composites (2 wt%) + ES. Scale bars, 100 μm.
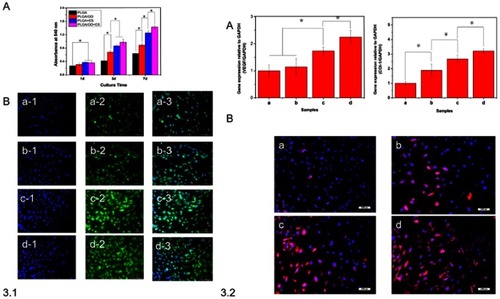
Figure 4 The differential effects of PLGA/GO composites and ES on wound healing. (A) Representative macroscopic appearance of wounds. (a) Control, (b) PLGA, (c) PLGA/GO composites (2 wt%), (d) PLGA + ES, and (e) PLGA/GO composites (2 wt%) + ES. (B) Wound-healing curves. *P<0.05 (n=5).
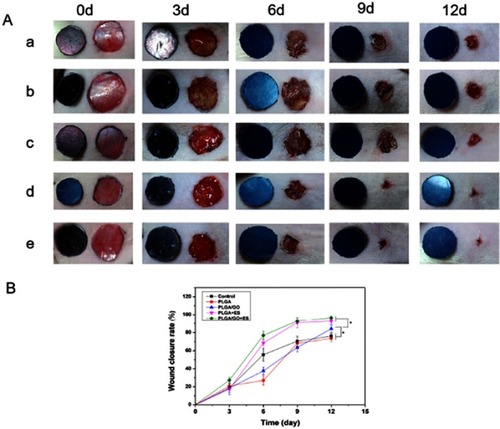
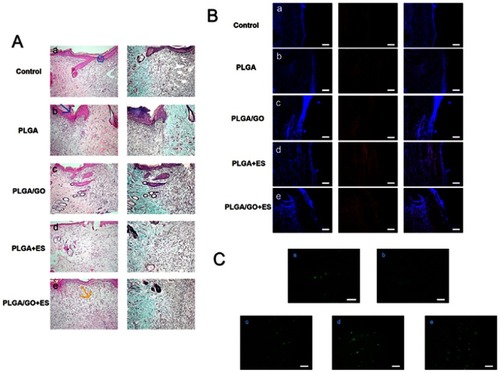
Figure 5 Differential effects of PLGA/GO composites and ES on tissue structure of wounds at 12 days. (A) Histological results. (a) Control, (b) PLGA biofilm, (c) PLGA/GO composites (2 wt%), (d) PLGA+ES, and (e) PLGA/GO composites (2 wt%) + ES. Magnification, 100×. Blue circle indicates subepidermal space, blue arrow indicates scar formation, yellow arrow indicates new capillary capillarie. (B) Immunofluorescence images of COL-1 levels in the wound-healing region at 12 days after different treatments. (a) Control, (b) PLGA biofilm, (c) PLGA/GO composites (2 wt%), and (d) PLGA+ES, and (e) PLGA/GO composites (2 wt%) + ES. Scale bars, 500 μm. (C) Immunohistochemical staining and quantification of CD31-positive microvessels in the wound-healing region at 12 days after different treatments. (a) Control, (b) PLGA, (c) PLGA/GO composites (2 wt%), and (d) PLGA+ES, and (e) PLGA/GO composites (2 wt%) + ES. Scale bars, 100 μm.