
Figures & data
Figure 1 Schematic representation of intravesical instillation of R-FL/P407, followed by gelation in the bladder, erosion-controlled R-FL release, and enhanced absorption via FR-mediated endocytosis.
Abbreviations: R-FL, rapamycin-loaded folate-modified liposome; P407, poloxamer 407; DP2KF, distearoylphosphatidylethanolamine-polyethylene glycol2000-folate; FR, folate receptor.
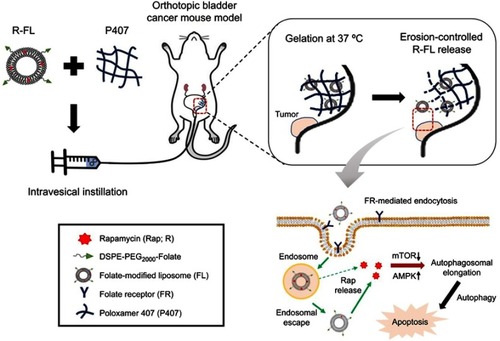
Table 1 Composition and physical characteristics of prepared liposomes
Figure 2 Characterization of prepared liposomes.
Notes: (A) Optimization of ligand density of R-FL evaluated by flow cytometry. Liposomes were loaded with DiI for MFI quantification. (B) Transmission electron microscopy images of liposomes. Scale bar indicates 200 nm. (C) Size distribution of R-FL by frequency. Data represent the means ± SD (n=3).
Abbreviations: MFI, mean fluorescence intensity; DP2KF, distearoylphosphatidylethanolamine-polyethylene glycol2000-folate; R, rapamycin; R-CL, rapamycin-loaded conventional liposome; R-FL, rapamycin-loaded folate-modified liposome.
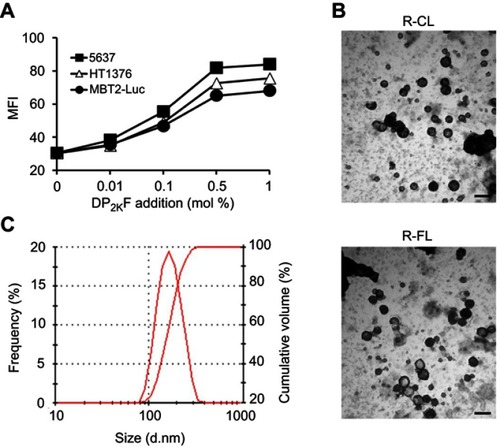
Figure 3 Stability evaluation of R-FL during storage at 4 °C (●) and 25 °C (△) for 4 weeks.
Notes: Statistical analysis was performed using the Student’s t-test (*P<0.05 versus 4 °C). Data represent the means ± SD (n=3).
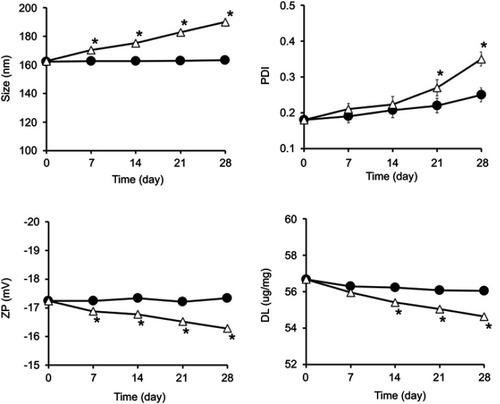
Figure 4 FR expression and comparison of the liposomal cell uptake in FR-positive cell lines.
Notes: (A) Western blot for FR-expression. GAPDH was used as a loading control to ensure the equal loading of gels. (B) Flow cytometry results for treatment effect after 2 h incubation. (C) Competitive assay of FL internalization under folic acid-untreated or folic acid-pretreated condition. (D) Confocal images for the time-dependent intracellular translocation of FL. White scale bar represents 100 µm. Data represent the means ± SD (n=3). Statistical analysis was performed using the Student’s t-test (*P<0.05 versus the paired group).
Abbreviations: FR-α, folate receptor α; CL, conventional liposome; FL, folate-modified liposome.
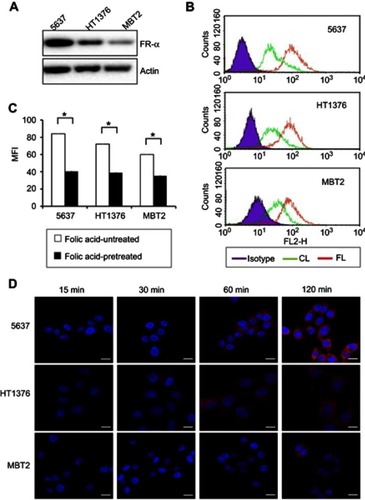
Figure 5 Effects of Rap-loaded formulations on growth inhibition in URCa cells.
Notes: (A) MTT assay with various concentration of Rap-loaded formulations. Data represent the means ± SEM (n=6). (B) Colony forming assay with Rap-loaded formulations (1 μg/mL).
Abbreviations: Rap, rapamycin; R-CL, rapamycin-loaded conventional liposome; R-FL, rapamycin-loaded folate-modified liposome.
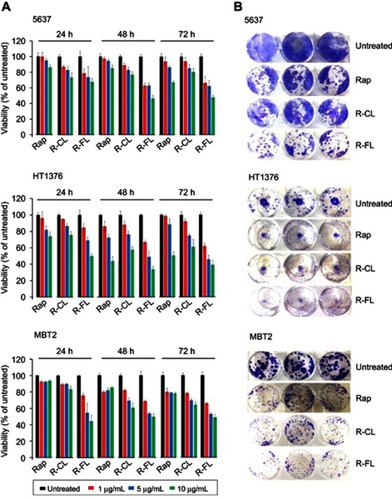
Figure 6 Effects of Rap-loaded formulations on mTOR inhibition and autophagy induction in URCa cells.
Notes: (A) Inhibition of phosphorylation of mTOR and mTOR downstream proteins. (B) Induction of AMPKα activation and ULK phosphorylation at Ser757. (C) Accumulation of p62/ATG5 and cleaved LC3B-II. Actin was used as a loading control.
Abbreviations: Un, untreated; Rap, rapamycin; R-CL, rapamycin-loaded conventional liposome; R-FL, rapamycin-loaded folate-modified liposome; Baf, bafilomycin A1.
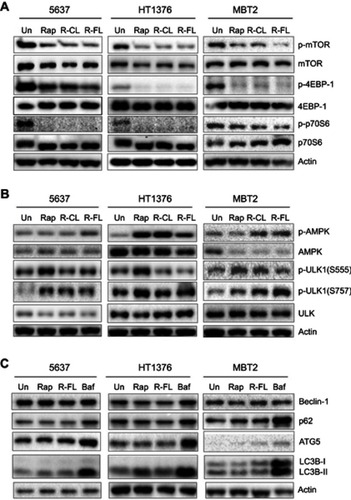
Figure 7 Drug release and gel erosion characteristics of Rap-loaded liposomal gels.
Notes: (A) In vitro drug release profile as a function of time. (B) Gel erosion profile as a function of time. (C) Correlation between liposomal Rap release and gel erosion. Data represent the means ± SD (n=3).
Abbreviations: Rap, rapamycin.
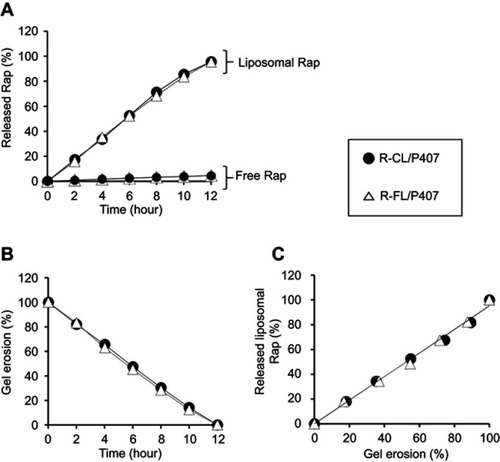
Figure 8 Comparison of in vivo antitumor efficacy of different samples in the orthotopic bladder cancer model in C3H mice.
Notes: (A) In vivo imaging acquired via BLS. For statistical analyses, tumor bioluminescence following treatment was normalized against the initial bioluminescence on day 4. (B) ROI-time plots for quantitative comparison (*P<0.05, **P<0.01 versus R-CL/P407). Arrows indicate instillations. Data represent the means ± SD (n=7). (C) Inhibition of mTOR signaling and induction of cleaved PARP. The blots are representative of three independent experiments.
Abbreviations: R, rapamycin; R-CL, rapamycin-loaded conventional liposome; R-FL, rapamycin loaded folate-modified liposome; P407, poloxamer 407; BLS, bioluminescence signal; ROI, region of interest.
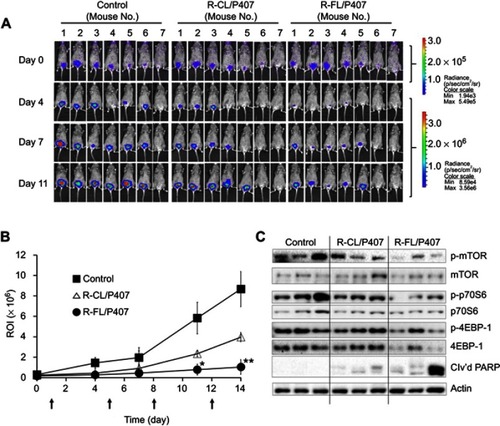
Figure S1 Stability evaluation of R-CL during storage at 4 °C (●) and 25 °C (△) for 4 weeks.
Notes: Data represent the means ± SD (n=3).
Abbreviations: PDI, polydispersity index; ZP, zeta potential.
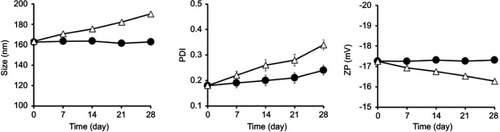
Table 2 Gel forming capacities of Rap-free P407 and Rap-loaded liposomal gel
Table S1 Composition and physical characteristics of prepared liposomes