Figures & data
Figure 1 Transmission electron micrographs and optical absorption of 5, 10, 30, and 60 nm PEG-coated gold particles.
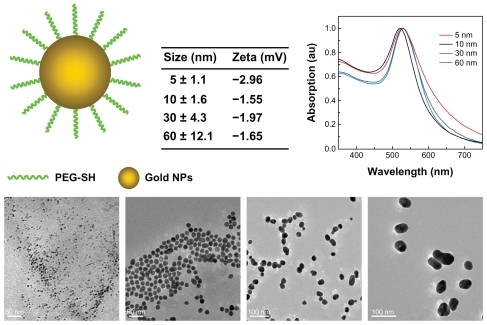
Figure 2 Body weight changes in mice for the 5, 10, 30, and 60 nm PEG-coated gold particles at a dose of 4000 μg/kg. The body weight of the treated mice was measured every 2 days. Each point represents the mean ± standard deviation of six mice. Data were analyzed using the Student’s t-test and the differences between the different doses and control group for each organ were not significant (P > 0.05).
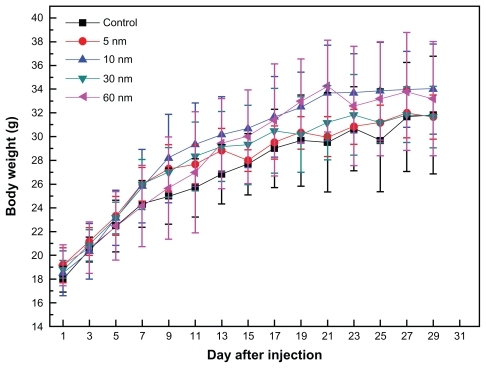
Figure 3 Biodistribution of body weight in mice for 5, 10, 30, and 60 nm PEG-coated gold particles at the dose of 4000 μg/kg after 28 days of treatment. Spleen and liver were the main target accumulation organs. The 5 nm particles had a wide distribution in live, heart, kidney, while the 10 and 30 nm particles preferentially stayed in the liver and spleen, respectively.
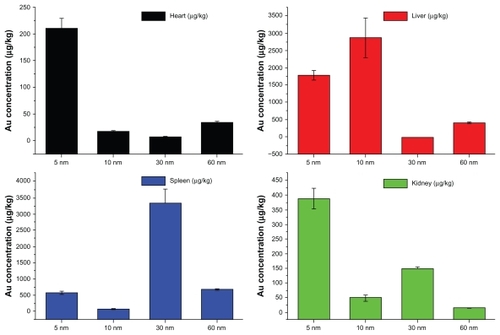
Figure 4 Transmission electron micrographs of 5, 10, 30, and 60 nm PEG-coated gold particles in bone marrow and blood cells 28 days after intraperitoneal injection at a dose of 4000 μg/kg. In the bone marrow cells, the gold particles can be found as monodispersed particles, and aggregations of 10 nm and 60 nm particles are found in the blood cells.
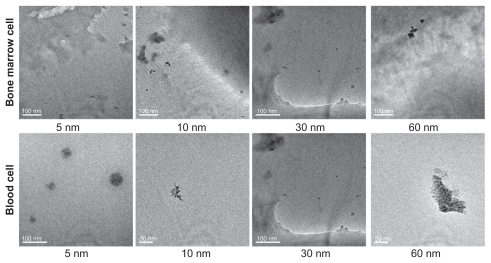
Table 1 Weights for the liver, lung, spleen, kidneys, heart, and thymus for 5, 10, 30, and 60 nm PEG-coated gold particles at a dose of 4000 μg/kg after 28 days
Figure 5 Size-dependent spleen and thymus indices of mice were calculated 28 days after 4000 μg/kg intraperitoneal injections.
Notes: All values are reported as the mean ± standard deviation. Data were analyzed using Student’s t-test. *Represents a significant difference from the control group (P < 0.05).
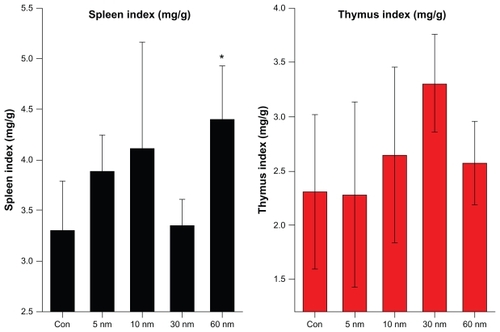
Figure 6 Size-dependent hematology results from mice treated with PEG-coated gold nanoparticles and control group 28 days after intraperitoneal injection at the dose of 4000 μg/kg. These results show mean and standard deviations of (A) white blood cells, (B) red blood cell, (C) hemoglobin, (D) mean corpuscular hemoglobin, (E) platelet, (F) hematocrit, (G) mean corpuscular volume, and (H) mean corpuscular hemoglobin concentration.
Notes: Bars represent mean ± standard deviation. Data were analyzed using the Student’s t-test. *Represents a significant difference from the control group (P < 0.05).
Abbreviations: WBC, white blood cells; RBC, red blood cell; HGB, hemoglobin; MCH, mean corpuscular hemoglobin; PLT, platelet; HCT, hematocrit; MCV, mean corpuscular volume; MCHC, mean corpuscular hemoglobin concentration.
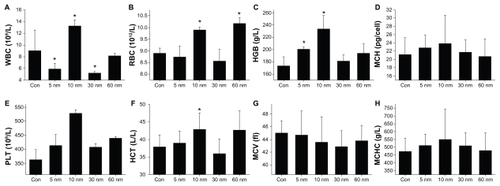
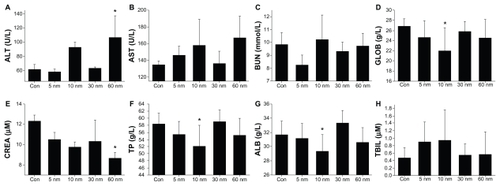
Figure 7 Size-dependent biochemical results for mice treated with PEG-coated gold nanoparticles and control group 28 days after intraperitoneal injection at a dose of 4000 μg/kg. These results show mean and standard deviations of (A) alanine transaminase, (B) aspartate transaminase, (C) blood urea nitrogen, (D) globulin, (E) creatinine, (F) total protein, (G) albumin, and (H) total bilirubin.
Notes: Bars represent mean ± standard deviation. Data were analyzed by Student’s t-test. *Represents significant difference from the control group (P < 0.05).
Abbreviations: ALT, alanine transaminase; AST, aspartate transaminase; BUN, blood urea nitrogen, GLOB, globulin, CREA creatinine; TP, total protein; ALB, albumin; TBIL, total bilirubin.