Figures & data
Table 1 The Physical Properties of Liposomal Formulations Containing ZYZ-802. Five Independent Batches of Each Liposome Formulation Were Evaluated to Calculate the Mean Diameter, Zeta-Potential and Entrapment Efficiency
Table 2 Liposomal Formulations Stability. Five Independent Batches of Liposome Were Stored and Sealed in Sterile Vials at 4°C for 30 and 60 Days. Thereafter, Samples were Taken Out from the vials for Characterization Including Particle Size, and Entrapment Efficiency Evaluation. The stability of liposomal ZYZ-802 Was Assessed in Line with the Original Values Before Storage
Figure 1 Characterization of liposomal ZYZ-802. Morphological analysis of DP-ZYZ-802 and SA-ZYZ-802 was performed by using Transmission electron micrograph.
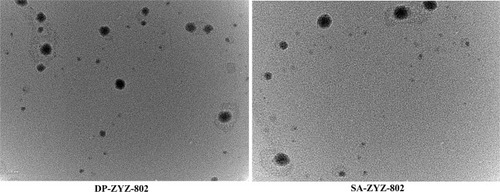
Figure 2 SA-ZYZ-802 and DP-ZYZ-802 prolong the release of ZYZ-802 as determined in vitro and in vivo. (A) Representative in vitro release profiles of ZYZ-802, DP-ZYZ-802 and SA-ZYZ-802 measured by HPLC (n=3). (B) Plasma concentration–time curves after intravenous injection of ZYZ-802, DP-ZYZ-802 and SA-ZYZ-802 in rats (n=6). (C–G) Heart, liver, kidney, spleen and lung tissues ZYZ-802 concentrations at different time points (1, 6, 12 and 24 hrs) after intravenous injection of ZYZ-802, DP-ZYZ-802 and SA-ZYZ-802 in rats (n=6). ZYZ-802 plasma and tissue concentration were measured using LC-MS/MS. The graph is representative of six rats per group and the results are expressed as mean ± SEM. Detailed data are listed in Supplementary Tables S1 and S2.
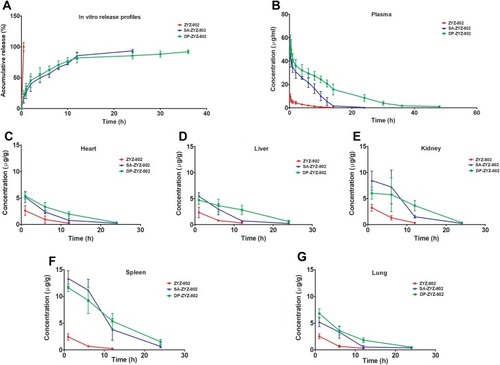
Figure 3 Liposome formulations increased plasma and tissue H2S concentrations and the protein expression of CSE. (A) Plasma H2S concentrations at different time points after intravenous injection of ZYZ-802, DP-ZYZ-802 and SA-ZYZ-802 in rats, respectively (n=6). The graph is representative of six rats per group and the results are expressed as mean ± SEM. (B–F) Heart, liver, kidney, spleen and lung tissues H2S concentrations at different time points after intravenous injection of ZYZ-802, DP-ZYZ-802 and SA-ZYZ-802 in rats, respectively (n=6). After intravenous injection, the concentrations of H2S gas at 1 hr, 6 hrs, 12 hrs and 24 hrs were measured using LC-MS/MS, respectively. The graph is representative of six rats per group and the results are expressed as mean ± SEM. (G–H). Finally, the expression of CSE in tissue of animals determined by Western blot (n=6), the blot and bar graph are representative of six independent experiments. Data are presented as fold change of the heart. Results are expressed as mean ± SEM. &P<0.05 vs heart. Detailed data are listed in Supplementary Tables S3 and S4.
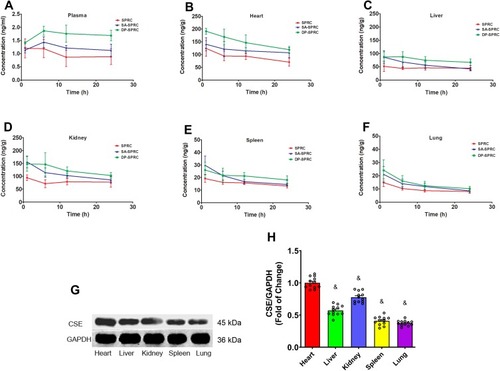
Figure 4 DP-ZYZ-802 decreased cardiac fibrosis, infarct size and HW/BW. (A) High-magnification microphotograph of Masson-stained sections from border zones in indicated treatment groups. (B) Photograph of infarct size which was determined following staining with 1% triphenyltetrazolium chloride (TTC). (C) The infarct sizes were calculated by the ratio of the infarct area and left ventricle. The picture and bar graph are representative of eight rats per group (n=8) and the results are expressed as mean ± SEM. (D) Representative statistical analysis of HW/BW with Sham (n=8), HF (n=12), ZYZ-802 (n=10) and DP-ZYZ-802 (n=10). Results are expressed as mean ± SEM, #P<0.05 vs Sham, *P<0.05 vs HF, &P<0.05 vs ZYZ-802.
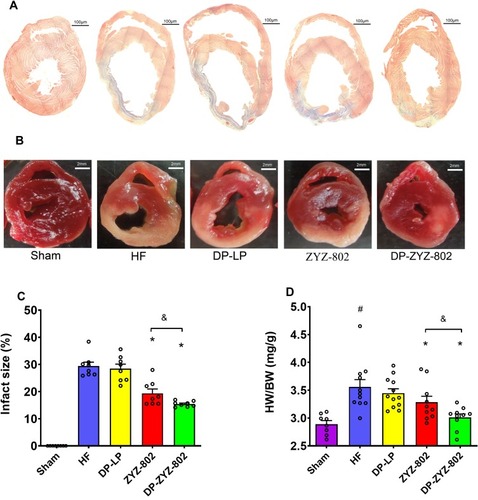
Figure 5 DP-ZYZ-802 improves cardiac function after myocardial infarction. (A–F) Echocardiographic recordings obtained from a short-axis mid-ventrical view of hearts indicating the changes in the ejection fraction (EF), and fractional shortening (FS), left ventricular internal dimension in systole (LVIDs), left ventricular internal dimension in systole (LVAWs), left ventricular posterior wall in systole (LVPWs) and left ventricular volume in systole (LVs) (n=6). The bar graph is representative of six rats per group and the results are expressed as mean ± SEM, #P<0.05 vs Sham, *P<0.05 vs HF, &P<0.05 vs ZYZ-802.
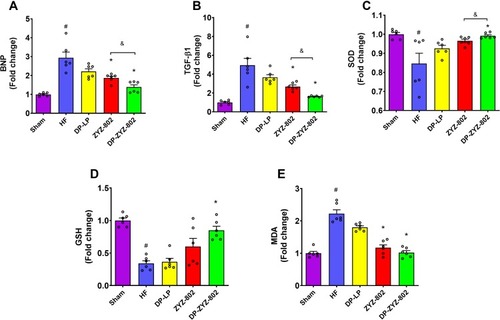
Figure 6 DP-ZYZ-802 alters antioxidant defences and improves cardiac function in myocardial infarction. (A–B) Serum levels of BNP and TGF-β1 6 weeks after infarction induction (n=6), and (C–E) serum levels of SOD, GSH and MDA in all groups 6 weeks after infarction (n=6). Data are presented as fold change of Sham group. The bar graph is representative of six independent experiments and the results are expressed as mean ± SEM; #P<0.05 vs Sham, *P<0.05 vs HF, &P<0.05 vs ZYZ-802.
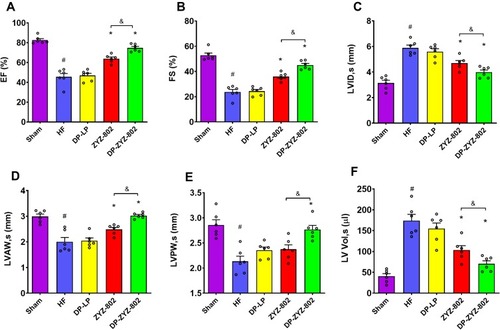
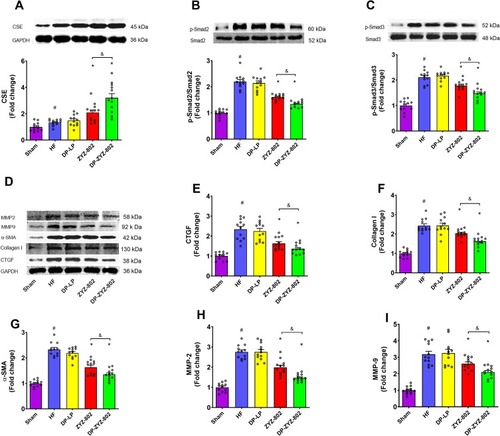
Figure 7 DP-ZYZ-802 increases the expression of the H2S biosynthetic enzymes CSE in heart tissues and alleviates cardiac fibrosis after myocardial infarction. (A) The expression of CSE in the heart following Western blot analysis (n=6). (B–I) Western blot and statistically analysis indicate that DP-ZYZ-802 decreases the expression of p-Smad2/3, CTGF, Collagen I, α-SMA, MMP-2 and MMP-9 in hearts following myocardial infarction (n=6). The blot and bar graph are representative of six independent experiments. Data are presented as fold change of Sham group. Results are expressed as mean ± SEM, #P<0.05 vs Sham, *P<0.05 vs HF, &P<0.05 vs ZYZ-802.