Figures & data
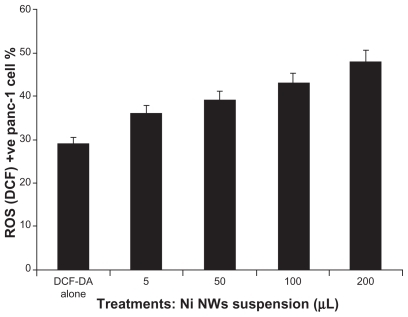
Figure 1 Schematic of Ni NWs fabrication procedure.
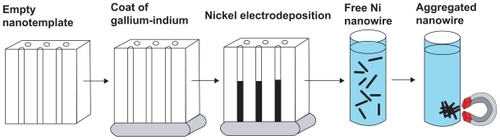
Figure 2 Characterization of fabricated Ni NWs. (A) Energy dispersive X-ray analysis spectrum of Ni NWs for elemental analysis; (B) UV-Vis spectrum of Ni NWs suspended in ddH2O at neutral pH (7.00); (C) vertically aligned magnetic Ni NWs on the bottom of a beaker; (D) illustration of magnetic properties of Ni NWs; (E) Ni NWs suspended in aqueous media.
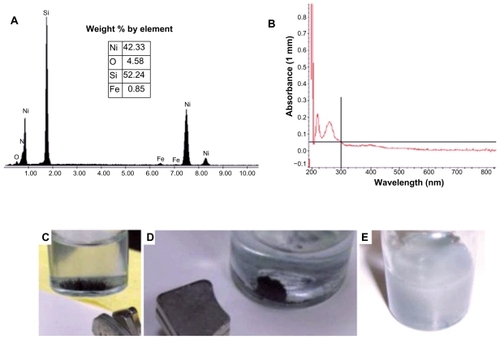
Figure 3 Electron micrograph of Ni NWs. (A) SEM of Ni NWs; (B) TEM of Ni NWs.
Abbreviations: SEM, scanning electron microscopy; TEM, transmission electron microscopy.
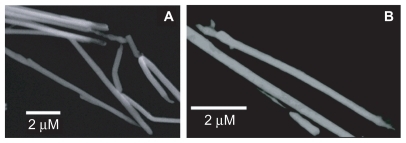
Figure 4 Morphological characteristics of Panc-1 cells which were treated with 200 μl of Ni NWs suspension for 0 (control), 8, 16, and 24 hours and visualized with phase contrast microscope (magnification 40×). Increasing detachment of cells from the well surface is seen with increasing exposure time. (A) Adherent cells without Ni NWs (control); (B) adherent (black arrows) and suspended (red arrows) cells with internalized Ni NWs after 8 hours; (C) adherent and a greater number of suspended cells with internalized Ni NWs after 16 hours; (D) Adherent and suspended cells with internalized Ni NWs after 24 hours. (E–G) represent more specific cellular morphological changes. (E) Uptake of Ni NWs by endocytosis to the cell cytoplasm; (F) internalization of Ni NWs to the cell nucleus followed by cell shrinkage, round shaped, and initiation of membrane blebbing; (G) apoptotic body formation through final membrane blebbing.
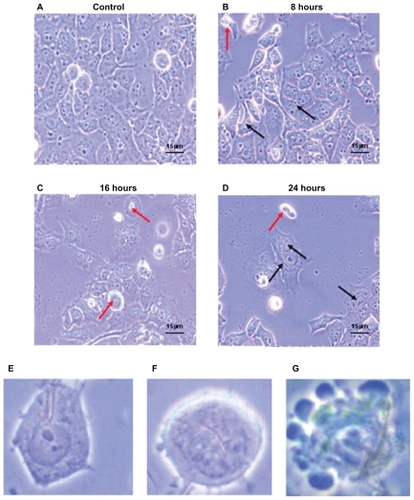
Figure 5 Panc-1 cells treated with Ni NWs which potentiates apoptosis. Cells were treated with 200 μL Ni NWs for 8, 16, and 24 hours and stained with ethidium bromide (EB) and acridine orange (AO) and were visualized and photographed immediately with fluorescence microscope. (A) Control; (B) 8 hours after treatment – blue arrow indicates initial membrane blebbing of the apoptosed cells; (C) 16 hours after treatment – the white arrow indicates late membrane blebbing; (D) 24 hours after treatment. Cells were stained with AO and EB where viable cells were green nuclear fluorescence and apoptotic cells exhibit a red nucleus.
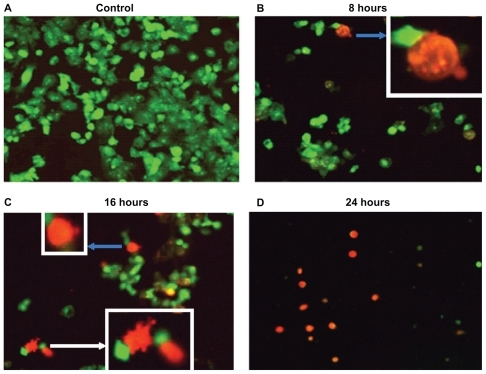
Figure 6 Effects of concentration of Ni NWs on apoptosis of Panc-1 cells after 24-hour exposure.
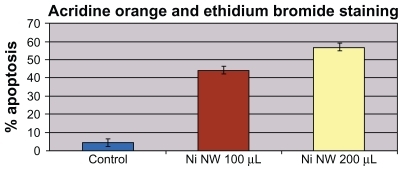
Figure 7 Qualitative morphological study of apoptosis by MTT assay. Phase contrast pictures of formazon in Ni NWs treated Panc-1 cells where (A) control, ie, untreated cells and (B) treated cells. Viable cells exhibited a deep purple cell nucleus with rod shaped formazon whereas apoptotic cells lacked formazon growth because of the lack of mitochondrial reductase and thus did not change in color. Dead cells are indicated by black arrows and live cells are identified by white arrows.
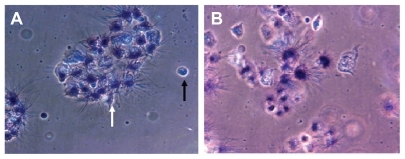
Figure 8 Quantitative 3-(4,5-dimethylthiazol-2yl)-2,5-diphenyl tetrazolium bromide (MTT) assay of cell viability and proliferation. Cell viability assay shows the effect of Ni NWs as concentration dependent reduction of viability in Panc-1 cells.
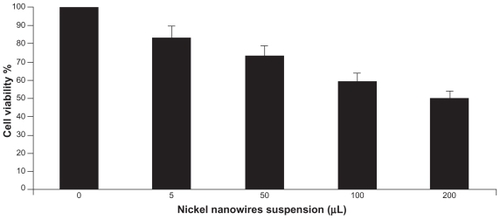
Figure 9 Cell cycle analysis after induction of apoptosis in Panc-1 cells by Ni NWs. The cells were incubated with Ni NWs for 24 hours, stained with PI and analyzed by Cell Quest Pro® on FC (BD-FACS Calibur®). A portrays untreated cells with all phases of the cell cycle, whereas B shows an exclusively increased sub-G1 peak with Ni NWs treatment.
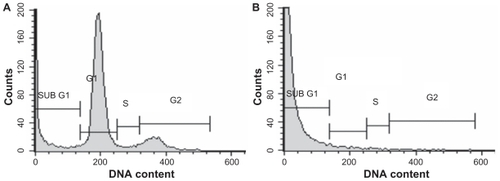
Figure 10 Ni NWs-induced reactive oxygen species generation in Panc-1 cells were measured by flow cytometry. The fluorescence intensities of 10,000 cells were analyzed by BD-FACS Calibur®. Representative histograms show cell number on the y-axis and increases of fluorescence (oxidant production) as right shifts on the x-axis (mean fluorescence intensity). (A) Cells without treatment; (B) cells treated with 0.3% H2O2; (C) Ni NWs treated cells; (D) overlay histogram of A–C.
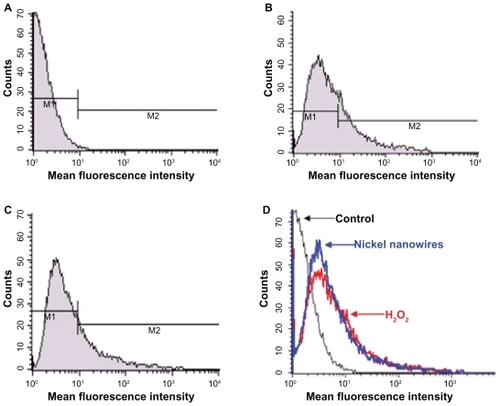
Figure 11 Quantification of reactive oxygen species (ROS) generation on Ni NW-induced Panc-1 cells stained with DCF-DA dye and measured by flow cytometry. This bar graph represents the concentration dependent ROS generation where the x-axis represents the concentration of Ni NWs and the y-axis denotes the percentage of ROS (DCF)-positive Panc-1 cells.