
Figures & data
Figure 1 (A) Microstructure of the biomaterials visualized by SEM (magnification 250x, scale bar =1 mm). (B) MicroCT cross-section images presenting porosity of the scaffolds (black color – pores, yellow/orange/green – nanohydroxyapatite ceramics, violet – polysaccharide matrix).
Abbreviations: SEM, scanning electron microscopy; microCT, microcomputed tomography; chit/aga/HA_L, chitosan/agarose/nanohydroxyapatite scaffolds with low [40 wt%] nanohydroxyapatite content; chit/aga/HA_H, chitosan/agarose/nanohydroxyapatite scaffolds with high [70 wt%] nanohydroxyapatite content.
![Figure 1 (A) Microstructure of the biomaterials visualized by SEM (magnification 250x, scale bar =1 mm). (B) MicroCT cross-section images presenting porosity of the scaffolds (black color – pores, yellow/orange/green – nanohydroxyapatite ceramics, violet – polysaccharide matrix).Abbreviations: SEM, scanning electron microscopy; microCT, microcomputed tomography; chit/aga/HA_L, chitosan/agarose/nanohydroxyapatite scaffolds with low [40 wt%] nanohydroxyapatite content; chit/aga/HA_H, chitosan/agarose/nanohydroxyapatite scaffolds with high [70 wt%] nanohydroxyapatite content.](/cms/asset/95705c2d-9d42-4957-b67a-d4692553223b/dijn_a_12191107_f0001_c.jpg)
Figure 2 (A) Phase-contrast images presenting growth of isolated ADSCs 24 hours (on the left) and 4 days (on the right) after plating the SVF onto T75 culture flask (magnification 100x, scale bar =200 µm); (B) CLSM images showing immunofluorescent staining of markers typical of ADSCs (CD90 – green fluorescence, CD29 – red fluorescence; magnification 400x, scale bar =100 µm).
Abbreviations: ADSCs, adipose tissue-derived mesenchymal stem cells; SVF, stromal vascular fraction; CLSM, confocal laser scanning microscope.
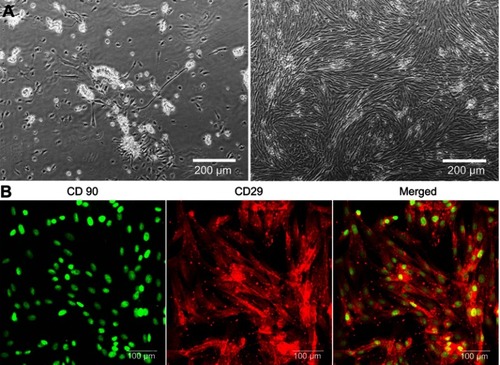
Figure 3 (A) Deconvoluted XPS peaks, revealing chemical states of atoms and allowing for identification of functional groups present on the surface of the scaffolds. (B) Quantitative evaluation of the chemical species, based on the peaks’ areas.
Abbreviations: XPS, X-ray photoelectron spectroscopy; chit/aga/HA_L, chitosan/agarose/nanohydroxyapatite scaffolds with low [40 wt%] nanohydroxyapatite content; chit/aga/HA_H, chitosan/agarose/nanohydroxyapatite scaffolds with high [70 wt%] nanohydroxyapatite content.
![Figure 3 (A) Deconvoluted XPS peaks, revealing chemical states of atoms and allowing for identification of functional groups present on the surface of the scaffolds. (B) Quantitative evaluation of the chemical species, based on the peaks’ areas.Abbreviations: XPS, X-ray photoelectron spectroscopy; chit/aga/HA_L, chitosan/agarose/nanohydroxyapatite scaffolds with low [40 wt%] nanohydroxyapatite content; chit/aga/HA_H, chitosan/agarose/nanohydroxyapatite scaffolds with high [70 wt%] nanohydroxyapatite content.](/cms/asset/1a66fa51-270a-43fc-acda-0e0a26a6f550/dijn_a_12191107_f0003_c.jpg)
Figure 4 (A) Deconvoluted XPS peaks, revealing chemical states of atoms and allowing for identification of functional groups present on the surface of individual components of the materials (chitosan, agarose, chitosan/agarose matrix, and nanoHA). (B) Quantitative evaluation of the chemical species, based on the peaks’ areas.
Abbreviations: XPS, X-ray photoelectron spectroscopy; aga, agarose; chit, chitosan; HA, hydroxyapatite.
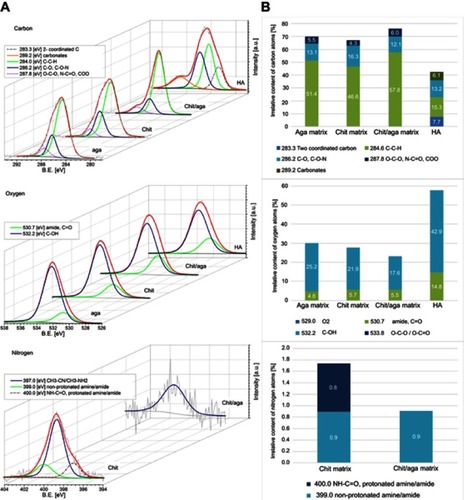
Table 1 Amount of adsorbed proteins to the chit/aga/HA_L and chit/aga/HA_H from human blood plasma and 1 mg/mL protein solutions
Figure 5 CLSM images presenting immunofluorescent staining of adsorbed proteins to the surface of the chit/aga/HA_L and chit/aga/HA_H scaffolds. (A) Experiment with the use of protein solutions at concentration of 1 mg/mL, (B) experiment with the use of human blood plasma (albumin – green fluorescence, fibrinogen – red fluorescence, fibronectin – blue fluorescence; Nomarski contrast was applied for the test control to visualize scaffolds' structure; magnification 100x, scale bar =150 µm).
Abbreviations: CLSM, confocal laser scanning microscope; chit/aga/HA_L, chitosan/agarose/nanohydroxyapatite scaffolds with low [40 wt%] nanohydroxyapatite content; chit/aga/HA_H, chitosan/agarose/nanohydroxyapatite scaffolds with high [70 wt%] nanohydroxyapatite content.
![Figure 5 CLSM images presenting immunofluorescent staining of adsorbed proteins to the surface of the chit/aga/HA_L and chit/aga/HA_H scaffolds. (A) Experiment with the use of protein solutions at concentration of 1 mg/mL, (B) experiment with the use of human blood plasma (albumin – green fluorescence, fibrinogen – red fluorescence, fibronectin – blue fluorescence; Nomarski contrast was applied for the test control to visualize scaffolds' structure; magnification 100x, scale bar =150 µm).Abbreviations: CLSM, confocal laser scanning microscope; chit/aga/HA_L, chitosan/agarose/nanohydroxyapatite scaffolds with low [40 wt%] nanohydroxyapatite content; chit/aga/HA_H, chitosan/agarose/nanohydroxyapatite scaffolds with high [70 wt%] nanohydroxyapatite content.](/cms/asset/b0b5e201-f9d1-4197-8890-b578f0651dd5/dijn_a_12191107_f0005_c.jpg)
Figure 6 Evaluation of cell adhesion and spreading on the surface of the scaffolds after 48-hour cell culture. (A) Fluorescent staining of cell cytoskeleton (F-actin – red fluorescence, nuclei – blue fluorescence; 40x objective and zoom factor 2, scale bar =20 µm). (B) Quantitative analysis of spreading area (polystyrene [PS] – control cells grown in PS well).
Abbreviations: chit/aga/HA_L, chitosan/agarose/nanohydroxyapatite scaffolds with low [40 wt%] nanohydroxyapatite content; chit/aga/HA_H, chitosan/agarose/nanohydroxyapatite scaffolds with high [70 wt%] nanohydroxyapatite content.
![Figure 6 Evaluation of cell adhesion and spreading on the surface of the scaffolds after 48-hour cell culture. (A) Fluorescent staining of cell cytoskeleton (F-actin – red fluorescence, nuclei – blue fluorescence; 40x objective and zoom factor 2, scale bar =20 µm). (B) Quantitative analysis of spreading area (polystyrene [PS] – control cells grown in PS well).Abbreviations: chit/aga/HA_L, chitosan/agarose/nanohydroxyapatite scaffolds with low [40 wt%] nanohydroxyapatite content; chit/aga/HA_H, chitosan/agarose/nanohydroxyapatite scaffolds with high [70 wt%] nanohydroxyapatite content.](/cms/asset/d941c3da-787b-422d-9ac1-232182a628db/dijn_a_12191107_f0006_c.jpg)
Figure 7 Proliferation of MC3T3-E1 (A) and hFOB 1.19 (B) osteoblasts on the surface of the bone scaffolds assessed by qualitative analysis via fluorescent staining of cells (cytoskeletal filaments – red fluorescence, nuclei – blue fluorescence; on the 3rd day Nomarski contrast was applied to additionally visualize scaffolds' structure; magnification 200x, scale bar =100 µm) and by quantitative analysis by nuclei counting; polystyrene (PS) – control cells grown in PS well (*statistically significant results compared to PS control in determined time interval; #statistically significant results compared to chit/aga/HA_H in determined time interval, n=3, P<0.05, one-way ANOVA followed by Tukey´s test).
Abbreviations: chit/aga/HA_L, chitosan/agarose/nanohydroxyapatite scaffolds with low [40 wt%] nanohydroxyapatite content; chit/aga/HA_H, chitosan/agarose/nanohydroxyapatite scaffolds with high [70 wt%] nanohydroxyapatite content.
![Figure 7 Proliferation of MC3T3-E1 (A) and hFOB 1.19 (B) osteoblasts on the surface of the bone scaffolds assessed by qualitative analysis via fluorescent staining of cells (cytoskeletal filaments – red fluorescence, nuclei – blue fluorescence; on the 3rd day Nomarski contrast was applied to additionally visualize scaffolds' structure; magnification 200x, scale bar =100 µm) and by quantitative analysis by nuclei counting; polystyrene (PS) – control cells grown in PS well (*statistically significant results compared to PS control in determined time interval; #statistically significant results compared to chit/aga/HA_H in determined time interval, n=3, P<0.05, one-way ANOVA followed by Tukey´s test).Abbreviations: chit/aga/HA_L, chitosan/agarose/nanohydroxyapatite scaffolds with low [40 wt%] nanohydroxyapatite content; chit/aga/HA_H, chitosan/agarose/nanohydroxyapatite scaffolds with high [70 wt%] nanohydroxyapatite content.](/cms/asset/aac07fae-3541-4a61-93bc-6742ec5a163c/dijn_a_12191107_f0007_c.jpg)
Figure 8 Production of osteogenic differentiation markers (A, D – collagen, B, E – bALP, C, F- OC) by MSCs cultured on the surface of the developed scaffolds and maintained in osteogenic medium without dexamethasone (-dex) (A–C) and in osteogenic medium with dexamethasone (+dex) (D–F); *statistically significant results compared to chit/aga/HA_L BMDSCs; #statistically significant results compared to chit/aga/HA_L ADSCs, n=3, P<0.05, unpaired t-test.
Abbreviations: MSCs, mesenchymal stem cells; BMDSCs, bone marrow-derived mesenchymal stem cells; ADSCs, adipose tissue-derived mesenchymal stem cells; chit/aga/HA_L, chitosan/agarose/nanohydroxyapatite scaffolds with low [40 wt%] nanohydroxyapatite content; chit/aga/HA_H, chitosan/agarose/nanohydroxyapatite scaffolds with high [70 wt%] nanohydroxyapatite content.
![Figure 8 Production of osteogenic differentiation markers (A, D – collagen, B, E – bALP, C, F- OC) by MSCs cultured on the surface of the developed scaffolds and maintained in osteogenic medium without dexamethasone (-dex) (A–C) and in osteogenic medium with dexamethasone (+dex) (D–F); *statistically significant results compared to chit/aga/HA_L BMDSCs; #statistically significant results compared to chit/aga/HA_L ADSCs, n=3, P<0.05, unpaired t-test.Abbreviations: MSCs, mesenchymal stem cells; BMDSCs, bone marrow-derived mesenchymal stem cells; ADSCs, adipose tissue-derived mesenchymal stem cells; chit/aga/HA_L, chitosan/agarose/nanohydroxyapatite scaffolds with low [40 wt%] nanohydroxyapatite content; chit/aga/HA_H, chitosan/agarose/nanohydroxyapatite scaffolds with high [70 wt%] nanohydroxyapatite content.](/cms/asset/5b0bd885-19d6-4d0d-bd71-eed367195fac/dijn_a_12191107_f0008_c.jpg)
Figure 9 CLSM images showing immunofluorescent staining of type I collagen in the ECM of MSCs cultured on the surface of developed scaffolds and maintained in osteogenic medium without dexamethasone (-dex) (A); and in osteogenic medium with dexamethasone (+dex) (B); collagen – red fluorescence, nuclei – blue fluorescence, magnification 400x, scale bar =50 µm.
Abbreviations: CLSM, confocal laser scanning microscope; ECM, extracellular matrix; MSCs, mesenchymal stem cells; BMDSCs, bone marrow-derived mesenchymal stem cells; ADSCs, adipose tissue-derived mesenchymal stem cells; chit/aga/HA_L, chitosan/agarose/nanohydroxyapatite scaffolds with low [40 wt%] nanohydroxyapatite content; chit/aga/HA_H, chitosan/agarose/nanohydroxyapatite scaffolds with high [70 wt%] nanohydroxyapatite content.
![Figure 9 CLSM images showing immunofluorescent staining of type I collagen in the ECM of MSCs cultured on the surface of developed scaffolds and maintained in osteogenic medium without dexamethasone (-dex) (A); and in osteogenic medium with dexamethasone (+dex) (B); collagen – red fluorescence, nuclei – blue fluorescence, magnification 400x, scale bar =50 µm.Abbreviations: CLSM, confocal laser scanning microscope; ECM, extracellular matrix; MSCs, mesenchymal stem cells; BMDSCs, bone marrow-derived mesenchymal stem cells; ADSCs, adipose tissue-derived mesenchymal stem cells; chit/aga/HA_L, chitosan/agarose/nanohydroxyapatite scaffolds with low [40 wt%] nanohydroxyapatite content; chit/aga/HA_H, chitosan/agarose/nanohydroxyapatite scaffolds with high [70 wt%] nanohydroxyapatite content.](/cms/asset/b55eb325-5881-4384-929b-86a47784b610/dijn_a_12191107_f0009_c.jpg)
Figure 10 CLSM images showing immunofluorescent staining of Runx2 in the MSCs cultured on the surface of developed scaffolds and maintained in osteogenic medium without dexamethasone (-dex) (A) and in osteogenic medium with dexamethasone (+dex) (B); Runx2 – green fluorescence, magnification 400x, scale bar =50 µm.
Abbreviations: CLSM, confocal laser scanning microscope; ECM, extracellular matrix; MSCs, mesenchymal stem cells; BMDSCs, bone marrow-derived mesenchymal stem cells; ADSCs, adipose tissue-derived mesenchymal stem cells; chit/aga/HA_L, chitosan/agarose/nanohydroxyapatite scaffolds with low [40 wt%] nanohydroxyapatite content; chit/aga/HA_H, chitosan/agarose/nanohydroxyapatite scaffolds with high [70 wt%] nanohydroxyapatite content.
![Figure 10 CLSM images showing immunofluorescent staining of Runx2 in the MSCs cultured on the surface of developed scaffolds and maintained in osteogenic medium without dexamethasone (-dex) (A) and in osteogenic medium with dexamethasone (+dex) (B); Runx2 – green fluorescence, magnification 400x, scale bar =50 µm.Abbreviations: CLSM, confocal laser scanning microscope; ECM, extracellular matrix; MSCs, mesenchymal stem cells; BMDSCs, bone marrow-derived mesenchymal stem cells; ADSCs, adipose tissue-derived mesenchymal stem cells; chit/aga/HA_L, chitosan/agarose/nanohydroxyapatite scaffolds with low [40 wt%] nanohydroxyapatite content; chit/aga/HA_H, chitosan/agarose/nanohydroxyapatite scaffolds with high [70 wt%] nanohydroxyapatite content.](/cms/asset/7e9d323a-bdfb-47c9-9ff9-ee6d8acfbdbe/dijn_a_12191107_f0010_c.jpg)