Figures & data

Table 1 Primers Sequences Applied in the Procedure of Comparing microRNA Distinguished Expressed Between T24 and RT4 Bladder Cancer Cells
Figure 1 MiR-155 sustains the proliferation rates of T24 cells and promotes the proliferation rates of RT4 cells assessed by CCK-8 assay.
Notes: T24 group represents T24 cells; miR155-inhibitor-T24 group represents T24 cells transfected with miR-155 inhibitors; inhibitor-NC-T24 group represents T24 cells transfected with miR-155 inhibitor-NCs; miR155-inhibitor-T24+miR155-mimic group represents T24 cells transfected by miR155-inhibitors and followed by miR155-mimics transfection; miR155-inhibitor-T24+mimic-NC group represents T24 cells transfected by miR-155-inhibitors and followed by miR155-mimic-NCs transfection. The RT4 group represents RT4 cells; miR155-mimic-RT4 group represents RT4 cells transfected by miR155-mimics; mimic-NC-RT4 group represents RT4 cells transfected by miR155-mimic-NCs; miR155-mimic-RT4+miR155-inhibitor group represents RT4 cells transfected by miR-155-mimics and followed by miR-155 inhibitor transfection; miR155-mimic-RT4+inhibitor-NC group represents RT4 cells transfected with miR-155-mimics and followed by miR-155 inhibitor-NCs transfection. Cells in the miR155-inhibitor-T24 group showed a lower proliferation rate compared to the original T24 group (A). Cells in the miR155-mimic-RT4 group showed a higher proliferation rate compared to the original RT4 group (B). ** p < 0.001.
Abbreviation: CCK-8, Cell counting kit-8.
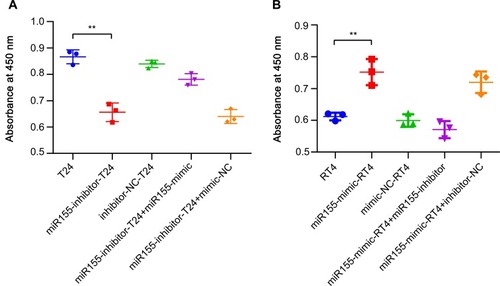
Figure 2 MiR-155 induced cell cycle re-distribution in T24 and RT4 cells.
Notes: A, B, C, D and E represent T24 group, miR155-inhibitor-T24 group, inhibitor-NC-T24 group, miR155-inhibitor-T24+miR155-mimic group and miR155-inhibitor-T24+mimic-NC group. F, G, H, I and J represent RT4 group, miR155-mimic-RT4 group, mimic-NC-RT4 group, miR155-mimic-RT4+miR155-inhibitor group and miR155-mimic-RT4+inhibitor-NC group. Compared to the T24 group, more cells were arrested in G0-G1 phase, and less cells were in the S phase in the miR155-inhibitor-T24 group (K). Cells in miR155-mimic-RT4 group accumulated in the S phase and decreased in G0-G1 phase compared to the original RT4 group (L). ** p < 0.001.
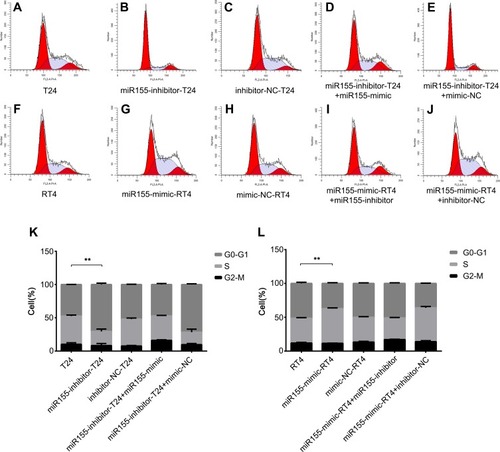
Figure 3 MiR-155 sustains the invasive ability of T24 cells and promotes the invasive ability of RT4 cells assessed by Transwell assay.
Notes: A, B, C, D and E represent T24 group, miR155-inhibitor-T24 group, inhibitor-NC-T24 group, miR155-inhibitor-T24+miR155-mimic group and miR155-inhibitor-T24+mimic-NC group. F, G, H, I and J represent RT4 group, miR155-mimic-RT4 group, mimic-NC-RT4 group, miR155-mimic-RT4+miR155-inhibitor group and miR155-mimic-RT4+inhibitor-NC group. Cell invasive abilities in the miR155-inhibitor-T24 group were decreased compared to the original T24 group (K). Also, cell invasive abilities in the miR155-mimic-RT4 group were significantly increased compared to the original RT4 group (L). Bar = 50 μm. ** p < 0.001.
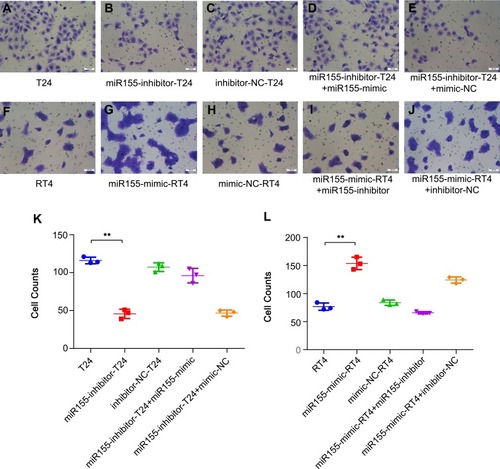
Figure 4 Micro-structures of TNTs between T24 and RT4 cells observed under SEM.
Notes: TNTs (A, Black arrows) were observed between T24 and RT4 cells. Continuous, membranous, micro-tubular connection between T24 and RT4 cells are shown (B, C and D). The TNTs structures were fragile (D). The diameter of TNTs ranged from 200 to 500 nm, and the lengths of TNTs between T24 and RT4 cells ranged from 20 μm to 1 mm.
Abbreviations: TNTs, tunneling nanotubes; SEM, scanning electron microscopic.
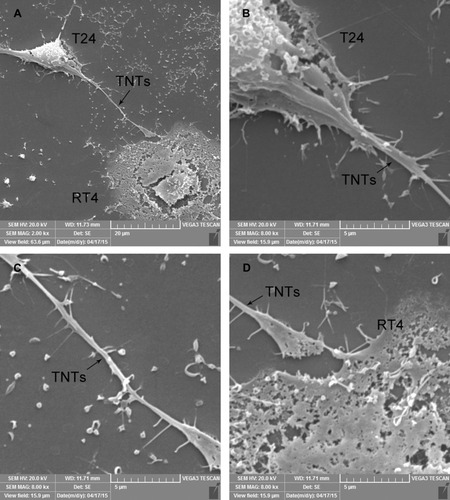
Figure 5 Intercellular transportation of miR-155 from T24 cells to RT4 cells via TNTs.
Notes: RT4 cells were labeled by CFSE (A, Green), and co-cultured with T24 cells for 24 hrs. MiR-155 was labeled by the fluorescent in situ hybridization probe (B, Red). F-actin was labeled by Phalloidin-iFluor™ 405 Conjugate (C, Blue). (A, B and C) were merged as (D). Spontaneous migration of miR-155 (B and D, White arrows) from T24 to RT4 cells via TNTs (C and D) was observed by capturing “double positive” (Red and Green) RT4 cells under fluorescence microscopy (D). Bar = 10 μm.
Abbreviation: miR-155, microRNA-155.
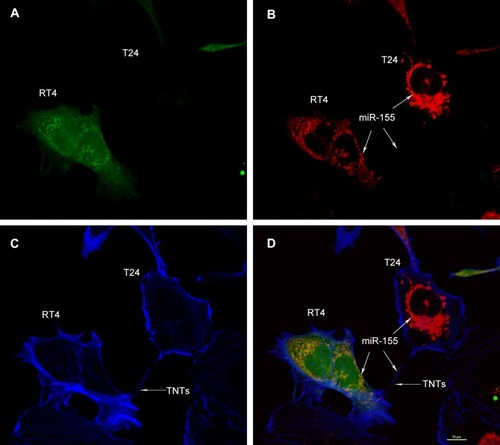
Figure 6 Expressions of Deptor, raptor, mTOR and p-mTOR proteins were analyzed in sub-groups of RT4 cells following miR-155 transfection by Western blotting.
Notes: Lane 1 represents the marker. Lanes 2, 3, 4, 5 and 6 represent groups RT4, miR155-mimic-RT4, mimic-NC-RT4, miR155-mimic-RT4+miR155-inhibitor and miR155-mimic-RT4+inhibitor-NC, respectively (A, C, E). The expression of Deptor was decreased in the miR-155-mimic-RT4 group compared to the original RT4 group. Both expressions of Raptor and p-mTOR were increased in the miR-155-mimic-RT4 group compared to the original RT4 group. However, no statistically significant difference was noted in mTOR levels among the five groups (B). The expression of 4EBP1, p-4EBP1 and p-p70S6K was increased in the miR155-mimic-RT4 group compared to the original RT4 group. However, no statistically significant difference was noted in p70S6K expression level among five groups (D). The expression of both p-eIF4E and p-S6RP was increased in the miR155-mimic-RT4 group compared to the RT4 group. However, no statistically significant difference was noted in eIF4E and S6RP expression levels among the five groups (F). * p < 0.05, ** p < 0.001.
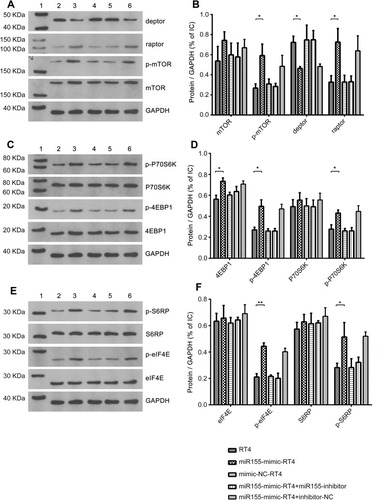
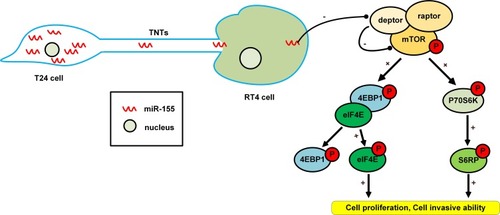
Figure 7 Schematic diagram of miR-155 intercellular transport and activation of mTOR signaling pathway.