Figures & data
Figure 1 Vertical bitewing radiographs of patient with OIDI in the primary dentition, showing characteristic features of pulpal obliteration and bulbous crowns.
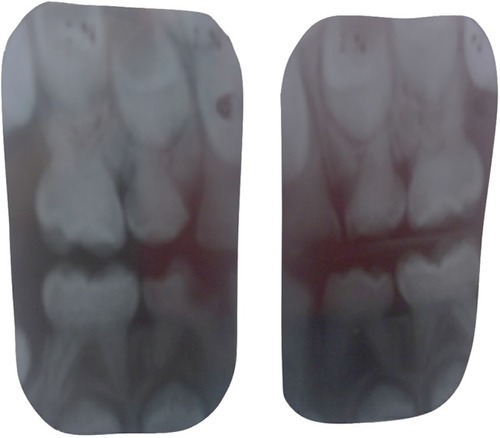
Figure 2 FTIR spectra (A) averaged composite FTIR spectra of control teeth pre-demineralisation (dotted line) and post-demineralisation (solid line). Images (SEM and AFM) present the control dentin surface pre- and post-demineralisation. (B) Infrared spectrum of the control (i) dentine, after 5 s (ii), 10 s (iii) and 15 s (iv) demineralisation. (C) Plot of pf the normalized intensity band ratio (Phosphate/Amide I) as function of the demineralisation time for control and OIDI dentin; dotted line marks the empirical threshold below which the surface is considered fully demineralised.
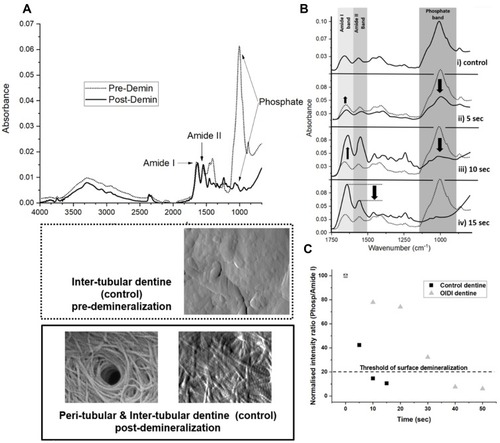
Figure 3 (A) SEM images of control dentin: i) pre-demineralisation (scale bar 20µm): regular dentinal tubule arrangement, tubules are open and uniform in appearance; ii) post demineralisation (scale bar 2µm): higher magnification image of tubules, collagen scaffold is visible inside the tubules and in the surrounding space; iii) and iv) post demineralisation (scale bar 800nm): higher magnification images showing regular D-banding periodicity of collagen fibrils. (B) SEM images of OIDI dentin: i) pre-demineralisation (scale bar 20µm): tubules varying in size and partially blocked or occluded; ii) post demineralisation (scale bar 2µm): “nesting” of several tubules can be seen within a larger tubule, collagen can be seen in the tubule (scale bar 2 µm), iii) post demineralisation (scale bar 800nm): higher magnification image showing regular D-banding periodicity of collagen fibril; iv) post demineralisation (scale bar 800nm): higher magnification image showing collagen fibril coalescence.
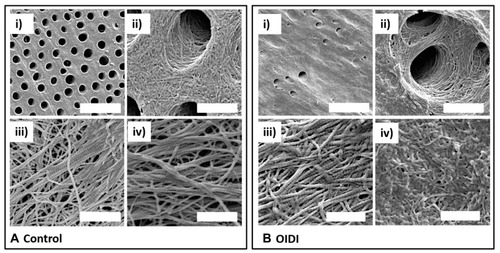
Figure 4 Graphical presentation of the nanoscale phenotypic properties (structural) for control and OIDI dentin: (A) boxplots of the measured dentinal tubules diameter (*significance p<0.05). (B) Boxplots of the measured collagen fibrils D-banding periodicity (no significant differences were observed). (C) Fitted histograms of the collagen fibril diameter with bimodal distributions (Gaussian) for OIDI collagen (R2>0.9) and for control collagen (R2>0.8).
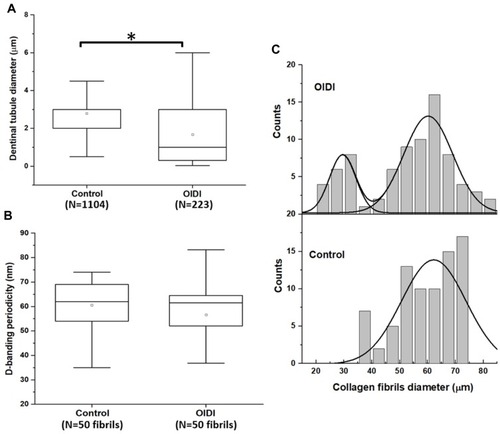
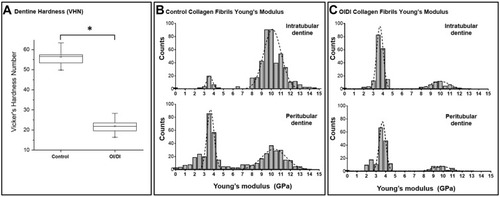
Figure 5 Graphical presentation of the nanoscale phenotypic properties (mechanical) for control and OIDI dentin (A) boxplots of the Vickers hardness value (*significance p<0.05). (B and C) Fitted histograms of the collagen fibril Young’s modulus with bimodal distributions (Gaussian R2>0.9 for all distributions) as a function of measurement site: intratubular and peritubular, respectively.