Figures & data
Figure 1 Electron microscope images of the surfaces of vertically aligned TiO2 nanotubes of 15 nm diameter. The inner and outer diameter of a small diameter nanotube are approximately 10 and 15 nm.
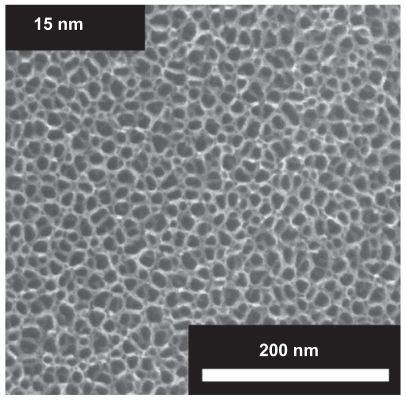
Figure 2 (A) Schematic figure of the orientation of quadrupolar proteins with positively charged tips attached to a negatively charged titanium surface.Citation15 (B) Schematic figure of a quadrupolar protein mediated attraction between a negatively charged titanium implant surface (left) and a negatively charged osteoblast surface (see also).Citation15 Two adjacent negatively charged titanium and osteoblast surfaces without bound proteins with a quadrupolar internal charge distribution end repel each other, while for a high enough concentration of bound proteins with a quadrupolar internal charge distribution the force between two negatively charged surfaces becomes strongly attractive,Citation15 leading to an equilibrium distance approximately equal to the dimension of the proteins.
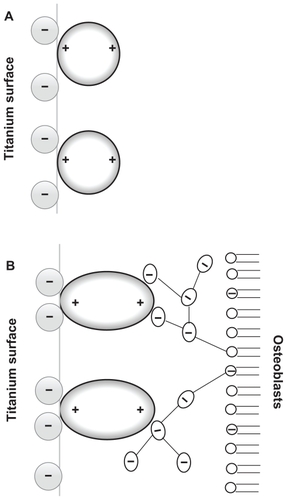
Figure 3 (A) Schematic figure of the adhesion of proteins with quadrupolar internal charge distribution at the sharp edge of a titanium surface. Due to the internal quadrupolar charge distribution, the proteins exhibit strong orientation in the direction of the surface normal vector (see also).Citation15 (B) Schematic figure of divalent cation-mediated adhesion of negatively charged fibronectin molecules to the highly curved edge of a titanium surface.
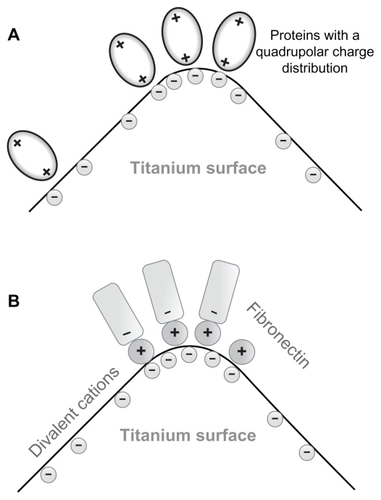
Figure 4 (A) Schematic figure of the convex edge of a titanium surface in the limit of a very high curvature. (B) Schematic figure of the concave edge (corner) of a titanium surface in the limit of a very high curvature.
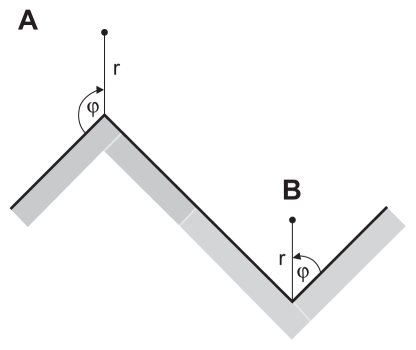
Table 1 Comparison of the surface charge densities at the top of a surface of the convex titanium edge (σtop) in the direction of the symmetry axis ϕ = 3π/4 (see also ) and at the corner of a concave surface (σcor) in the direction of the symmetry axis ϕ = π/4 (see also ) calculated for different values of the edge (corner) curvature radius (R) as described in the text
Figure 5 Schematic figure of two regions of a titanium surface: nanorough region 1 with high affinity for integrin molecules, and a smooth region 2 with low affinity for integrin molecules.
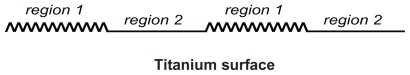
Figure 6 Effects of nanorough and smooth titanium regions on membrane growth. The modeled membrane segment that belongs to an osteoblast cell is a nearly straight membrane contour with embedded integrin molecules (A1). Nanorough titanium regions are separated by smooth titanium regions (A2). The implicit effect of the smooth and nanorough regions is incorporated into the free energy by having a zero integrin binding potential above the smooth titanium regions and nonzero integrin binding potential above the nanorough titanium regions. In addition, it was assumed that the integrin binding potential in the 10 nm thick layer above the nanorough titanium regions for simplicity was constant, ie, w ns = 0.011 g s−2. Time dynamics of the membrane shape (h(x)) and integrin density (n) for the adhesion of an osteoblast membrane to the implicitly modelled nanorough regions (A3). Note the coalescence of membrane protrusions over time, and the steady state (bottom panel) adhesion in a small number of patches to the titanium surface.
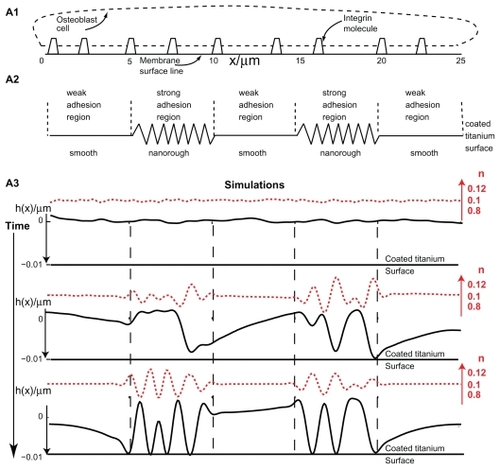
Figure 7 The protein mediated adhesion of an osteoblast to the nanorough region of a titanium surface is facilitated due to the increased surface charge density and electric field strength at highly curved convex edges and spicules.
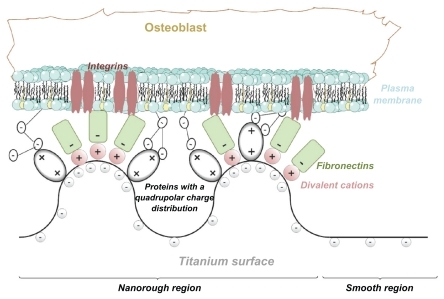
Figure B.1 Schematic figure of an electrical double layer near a negatively charged planar membrane surface. The water molecules in the vicinity of the charged surface are predominantly oriented towards the surface.
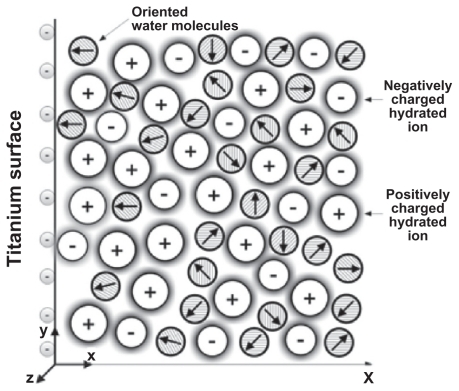
Figure B.2 Effective relative permittivity ɛr as a function of the distance from the planar charged surface x calculated within the presented Langevin PB theory with excluded volume for three values of the surface charge density: σ = − 0.1 As/m2 (dotted line), −0.2 As/m2 (dashed line) and −0.4 As/m2 (full line). EquationEqs.(B.7)(B.7) –Equation(B.10)
(B.10) were solved numerically for planar geometry using the Finite Element Method as described in the text. The dipole moment of water p0 was taken as 4.794 D, the bulk concentration of salt n0/NA = 0.15 mol/L and the bulk concentration of water n0w/NA = 55 mol/L.
![Figure B.2 Effective relative permittivity ɛr as a function of the distance from the planar charged surface x calculated within the presented Langevin PB theory with excluded volume for three values of the surface charge density: σ = − 0.1 As/m2 (dotted line), −0.2 As/m2 (dashed line) and −0.4 As/m2 (full line). EquationEqs.(B.7)∇·[ɛ0ɛr(r)∇φ(r)]=-ρfree(r),(B.7) –Equation(B.10)∇φ(r=rsurf)=-σnɛ0ɛr(r=rsurf),(B.10) were solved numerically for planar geometry using the Finite Element Method as described in the text. The dipole moment of water p0 was taken as 4.794 D, the bulk concentration of salt n0/NA = 0.15 mol/L and the bulk concentration of water n0w/NA = 55 mol/L.](/cms/asset/a6fa72c8-4771-4528-b728-999e699a3e99/dijn_a_21755_f0009_b.jpg)