Figures & data
Figure 1 UV-Vis absorption spectrum of gold NPs at 520 nm.
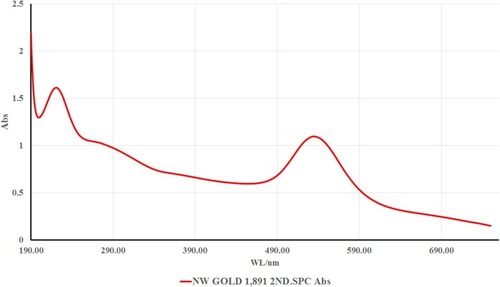
Figure 2 DLS data (A) gold NPs (zeta size 47.03±45.55 (d, nm) and PdI 0.328, zeta potential 39.5±5.74 (mV)); (B) chitosan TPP NPs (zeta size 156±45.55 (d, nm) and PdI 0.381, zeta potential −12.9±8.07 (mV)); (C) gold/chitosan NPs DLS data (zeta size 160.3±36.17 (d, nm) and PdI 0.581, zeta potential 63.9±4.01 (mV); (D) EGCG/chitosan NPs (zeta size 414.8±333.8 (d, nm) and PdI 0.363, zeta potential 67.6±4mV); (E) weighted mean zeta potential (EGCG), isoelectric point at pH 4.28 (EGCG), after centrifugation and auto-titration (F) weighted mean zeta potential (chitosan/poloxamer), isoelectric point at pH10.1 after centrifugation and auto-titration; (G) weighted mean zeta potential (chitosan/EGCG). Isoelectric point at pH 6.89 (chitosan/EGCG conjugation), after centrifugation and auto-titration.
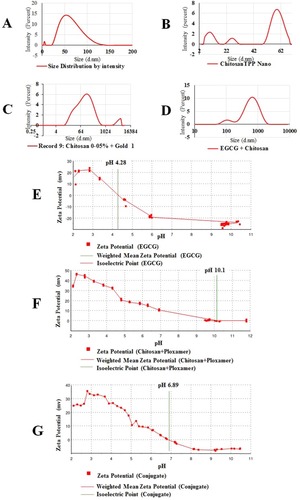
Figure 3 FTIR spectra recorded in the region of 900–4500 cm−1 of (A) chitosan/poloxamer, (B) EGCG, (C) EGCG/chitosan conjugation and self-assembled NPs and (D) combined (A–C).
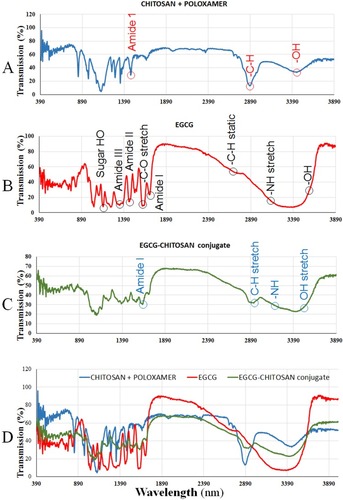
Figure 4 FTIR absorption spectra recorded in the region of 900–4500 cm−1 of (light blue) chitosan/poloxamer (red) EGCG (green) EGCG/chitosan conjugation.
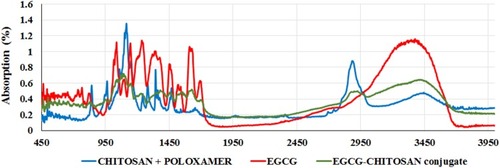
Figure 5 XPS spectra of lyophilized EGCG/chitosan conjugate and a table of elemental ID and quantification at various binding energy (eV) levels.
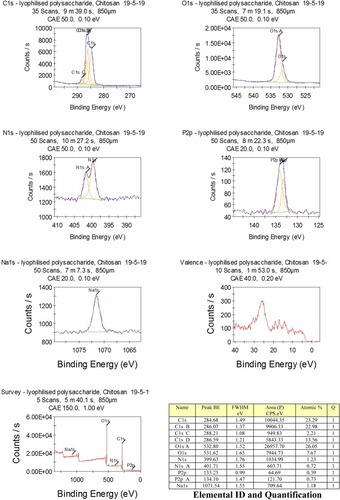
Figure 6 (A-B1): TEM image and corresponding ImageJ analysis. (A) TEM for gold NPs of various size and shape, size 47.03±45.55 (d, nm); (B) TEM image of chitosan/TPP NPs, size 156±45.55 (d, nm); (A1) ImageJ for (A and B1) ImageJ for 6B with peaks denoting the intensity of the NPs in each case. Scale bars 300 nm.
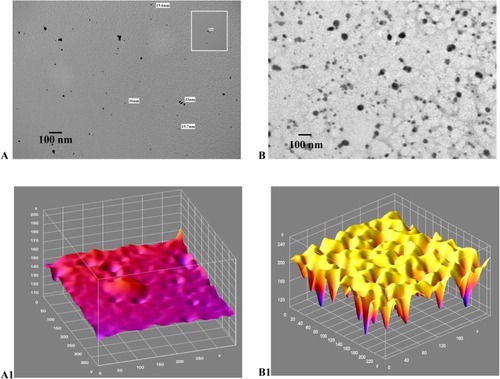
Figure 7 (A-B1): TEM image and corresponding ImageJ analysis. (A) TEM for gold/chitosan NPs of various size and shape, size 160.3±36.17 (d, nm); (B) TEM image of EGCG/chitosan/TPP NPs, size 414.8±333.8 (d, nm); (A1) ImageJ for (A and B1) ImageJ for 7B with peaks denoting the intensity of the NPs in each case. Scale bars 300 nm.
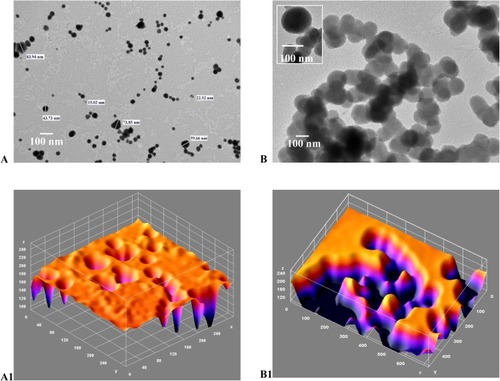
Figure 8 (A-B1): SEM image and corresponding ImageJ analysis. (A) Gold NPs of various size and shape, zeta size 47.03±45.55 (d, nm); (B) SEM image for chitosan/TPP NPs, zeta size 156±45.55 (d, nm); (A1) ImageJ for 8A and (B1) ImageJ for A with peaks denoting the intensity of the NPs in each case. Scale bars 300 nm.
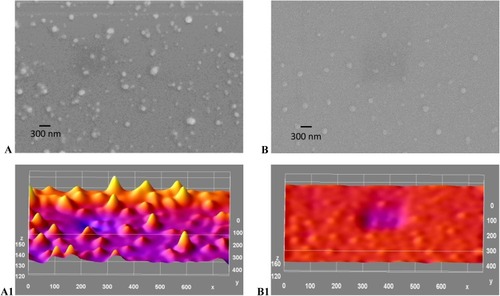
Figure 9 (A-B1): SEM image and ImageJ analysis. (A) Gold/chitosan NPs, size and shape, zeta size 160.3±36.17 (d, nm); (B) SEM image of EGCG/chitosan/TPP NPs with size of zeta size 414.8±333.8 (d, nm); (A1)ImageJ for (A and B1) ImageJ for (B) with peaks denoting the intensity of the NPs in each case. Scale bars 300 nm.
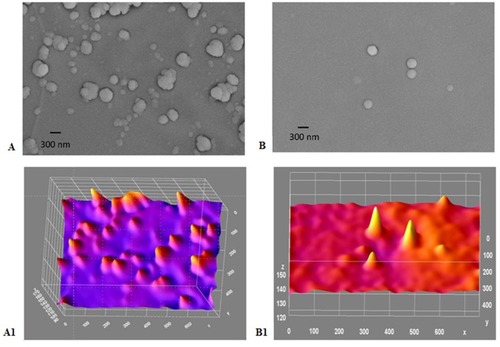
Figure 10 AFM image analysis for NPs showing 3D (left) and section data (right) of: (A) gold; (B) chitosan; (C) gold/chitosan and (D) EGCG/chitosan.
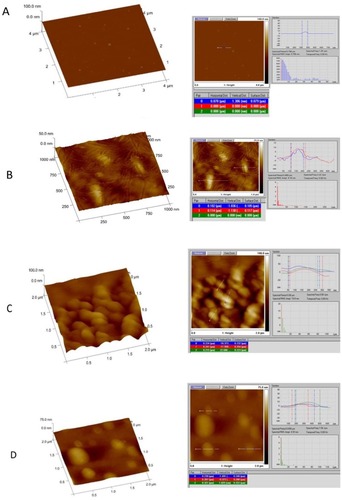
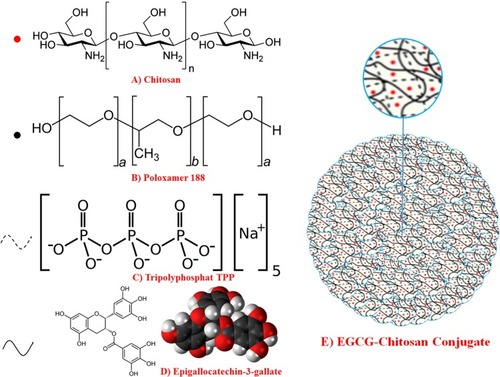
Figure 11 (A) Chemical structure of chitosan, (B) tripolyphosphate (TPP), (C) Poloxamer 188 (D) EGCG and (E) fabrication of Poloxamer (P188) loaded with chitosan nanoparticles via ionic gelation between the positively charged amino groups of chitosan (CS) and negatively charged tripolyphosphate (TPP) with EGCG trapped in.