Figures & data
Figure 1 (A) and (B) TEM images of NaxWO3 nanoparticles. (C) High-resolution TEM image of a NaxWO3 nanoparticle. (D) XRD pattern of NaxWO3 nanoparticles.
Abbreviations: TEM, transmission electron microscopy; XRD, X-ray diffraction.
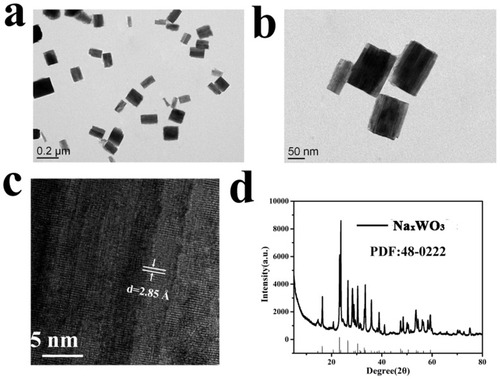
Figure 2 (A) UV-Vis-NIR absorbance of NaxWO3 nanoparticles solution (200 μg/mL), photograph of NaxWO3 nanoparticles solution was shown in the insert. (B) Temperature increase curves of a NaxWO3 nanoparticles solution under an 980 nm-wavelength laser irradiation at various concentrations (0, 0.25, 0.5, 1 mg/mL) at a power intensity of 1 W/cm2 for 5 mins. (C) Representative thermal images of water or NaxWO3 nanoparticles solution (1 mg/mL) under 980 nm-wavelength laser irradiation at a power intensity of 1 W/cm2. (D) Temperature increase curves of NaxWO3 nanoparticles solution (1 mg/mL) under various power intensity (0.5, 1, 1.5, 2 W/cm2) of 980 nm-wavelength laser for 5 mins. (E) Representative thermal images of NaxWO3 nanoparticles solution (1 mg/mL) under 980 nm-wavelength laser irradiation at a power intensity of 0.5 W/cm2 or of 2 W/cm2. (F) Four heating and cooling cycles of NaxWO3 nanoparticles solution (1 mg/mL) (980 nm laser, 1 W/cm2).
Abbreviation: NIR, near-infrared.
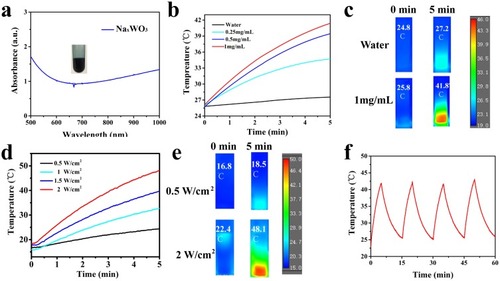
Figure 3 (A) Relative viabilities of 293T cells after they were incubated for 24 and 48 hrs with NaxWO3 nanoparticles of various concentrations (0, 12.5, 25, 50, 100, 200 mg/mL) (n=5, mean ± s.d.). (B) Inhibition of the growth of 4T1 cells incubated with NaxWO3 nanoparticles of various concentrations (0, 12.5, 25, 50, 100, 200 mg/mL) and then irradiated with 980 nm-wavelength lasers (1.5 W cm/2) for 5 mins (n=5, mean ± s.d.).
Abbreviation: PTT, photothermal therapy.
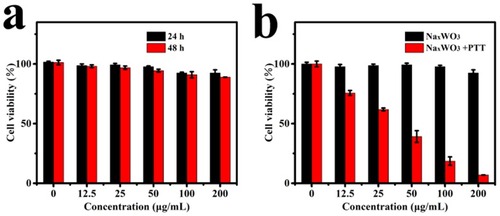
Figure 4 (A) Biodistribution profile of NaxWO3 nanoparticles in 4T1 tumor-bearing mice at various time intervals (4, 8, and 12 hrs) after the i.v. injection of NaxWO3 nanoparticles, as determined by measuring W in homogenized tissue solutions (n=3, mean ± s.d.). (B) Representative thermal images of bilateral 4T1 tumor-bearing mice that were irradiated with a 980 nm-wavelength laser (1.5 W cm/2) 8 hrs after injection with saline or NaxWO3 nanoparticles (20 mg/kg). (C) Time-dependent change of relative tumor volume after various treatments (n=5, mean ± s.d.). (D) Time-dependent change of mice body weight after various treatments (n=5, mean ± s.d.). (E) Representative images of H&E-stained tumor sections of various groups (control, control + 980 nm-wavelength laser, NaxWO3, NaxWO3 980 nm-wavelength laser).
Abbreviation: PTT, photothermal therapy.
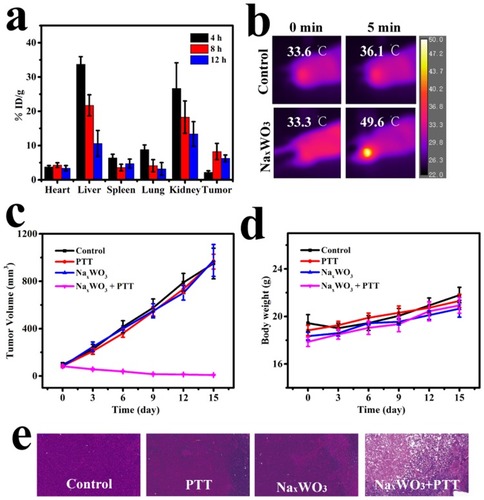
Figure 5 (A) Representative images of μCT of the tibia trabecular bone medial compartment treated with 0.9% sodium chloride (control group), PTT (PTT group), NaxWO3 (NaxWO3 group), and NaxWO3+PTT (NaxWO3+PTT group). Scale bar, 100 μM. (B) Bone volume/tissue volume (BV/TV) was measured by quantitative analysis of μCT. The significance was determined as indicated in methods (**P<0.01 versus control). (C) Evaluation of cachexia by body weight that was recorded every 2 weeks until 6th week. (D) Quantitation of tumor volume of mice in each group.
Abbreviation: PTT, photothermal therapy.
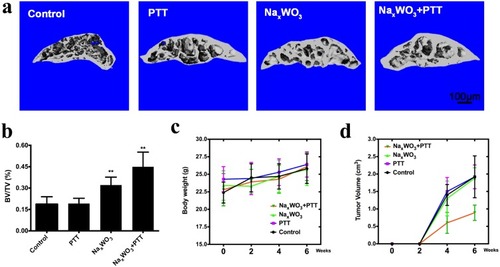
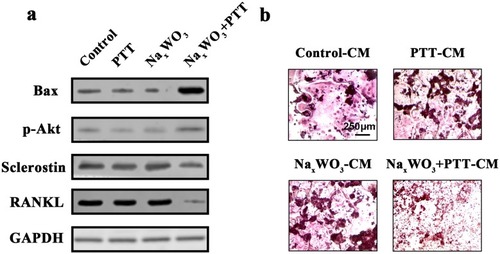
Figure 6 (A) Proteins expressions for Bax, p-Akt, Sclerostin and RANKL in 4T1 cells. (B) Osteoclastogenesis of RAW 264.7 cells at 7th day after stimulations by CM from 4T1 cells treated with control, PTT, NaxWO3, and NaxWO3+PTT. Scale bar, 250 μM.
Abbreviations: PTT, photothermal therapy; CM, conditioned medium.