Figures & data
Table 1 The Average Hydrodynamic Size, Zeta Potential and PDI of XFM19, XFM20 and XFM21
Figure 1 The characteristics of pristine MWCNTs (code XFM19), carboxylated MWCNTs (code XFM21) and hydroxylated MWCNTs (code XFM20). (A) SEM images; (B) TEM images; (C) the distribution of hydrodynamic size; and (D) the distribution of zeta potential.
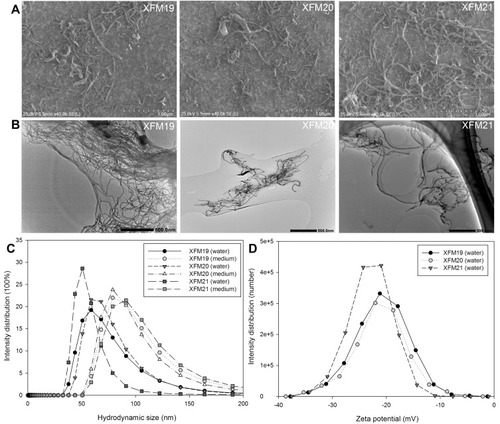
Figure 2 The FTIR spectrum of pristine MWCNTs (XFM19), hydroxylated MWCNTs (XFM20) and carboxylated MWCNTs (XFM21).
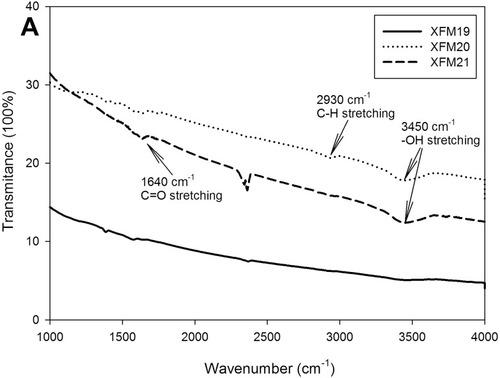
Figure 3 Cytotoxicity of MWCNTs to HUVECs. HUVECs were exposed to various concentrations of pristine MWCNTs (XFM19), hydroxylated MWCNTs (XFM20) or carboxylated MWCNTs (XFM21) for 24 hrs, and CCK-8 assay was done to indicate cytotoxicity. *p<0.01, compared with control.
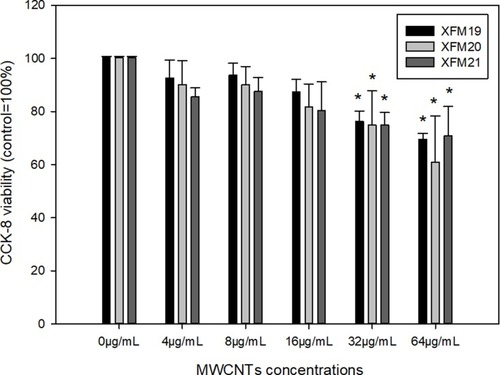
Figure 4 The ultrastructural changes of HUVECs. HUVECs were exposed to 64 μg/mL of pristine MWCNTs (XFM19), hydroxylated MWCNTs (XFM20) or carboxylated MWCNTs (XFM21). After 3 hrs exposure, TEM was used to image the ultrastructural changes of HUVECs and the internalized MWCNTs. The images in upper panel are images with low magnification, and the images in the lower panel are images with high magnification. The internalized MWCNTs were marked with arrows. Nuclei were marked with N and Mitochondria were marked with M.
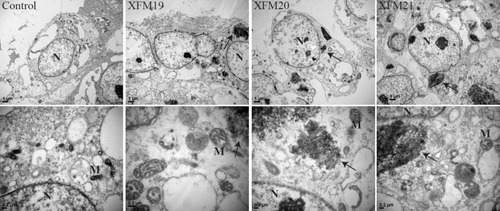
Figure 5 The changes of intracellular ROS (A) or GSH (B). HUVECs were exposed to various concentrations of pristine MWCNTs (XFM19), hydroxylated MWCNTs (XFM20) or carboxylated MWCNTs (XFM21) for 24 hrs, and intracellular ROS and GSH were determined by using a fluorescent probe. *p<0.01, compared with control.
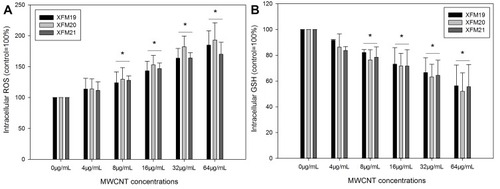
Figure 6 The protein levels of apoptotic proteins. HUVECs were exposed to 64 μg/mL of pristine MWCNTs (XFM19), hydroxylated MWCNTs (XFM20) or carboxylated MWCNTs (XFM21) for 24 hrs. After exposure, the levels of apoptotic proteins were measured by Western blot. (A) The Western blot bands; (B) the protein level of BCL-2; (C) the protein level of caspase-3; (D) the protein level of caspase-8. *p<0.01, compared with control.
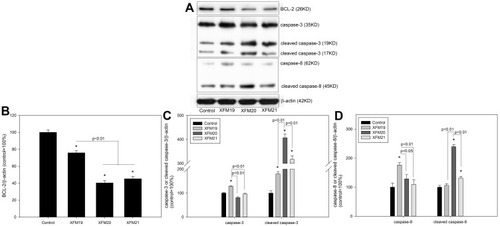
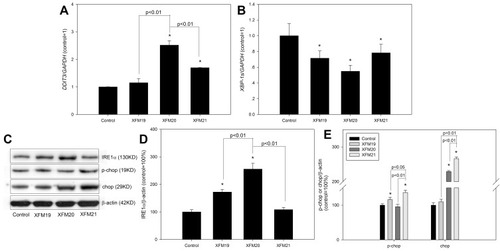
Figure 7 The changes of genes and proteins related with ER stress pathway. HUVECs were exposed to 64 μg/mL of pristine MWCNTs (XFM19), hydroxylated MWCNTs (XFM20) or carboxylated MWCNTs (XFM21) for 24 hrs. After exposure, the expression of genes was determined by qRT-PCR, and protein level was measured by Western blot. (A) The expression of DDIT3; (B) the expression of XBP-1s; (C) the Western blot bands; (D) the protein level of IRE1α; (E) the protein level of p-chop and chop. *p<0.05, compared with control.