Figures & data
Table 1 Nanoparticle Size Distribution, Zeta Potential, And Polydispersity Index
Scheme 1 The timeline of immunization and overall in vivo work through the terminal point on day 52.
Figure 1 Physical–structural characterization of chitosan nanoparticles.
Notes: (A) Schematic representation of the recombinant Ags adsorbed on CNPs; (B) morphological characteristics of CNPs by TEM observation; (C) the adsorption efficiency of the recombinant Ags adsorbed on CNPs. Each bar indicates the mean ± SD from three independent experiments. *P < 0.05.
Abbreviations: CNPs, chitosan nanoparticles; TEM, transmission electron microscopy; PDI, polydispersity index; SD, standard deviation.
Figure 2 Production of antigen-specific Ig antibodies and the sIgA antibodies in immunized mice.
Notes: Antigen-specific Ig antibodies and the sIgA antibodies against the C. psittaci Ags were induced 14 days after the final immunization in vaccinated BALB/c mice. (A) The sera were collected from immunized mice to determine antigen-specific IgG antibody levels by ELISA at dilutions of 1:200. (B) The serum IgA was detected by ELISA at dilutions of 1:200. And the nasal washes and vaginal washes collected from immunized mice were determined of the sIgA antibodies' levels by ELISA at dilutions of 1:10. Each bar indicates the mean ± SD of triplicates from 6 mice per group. *P < 0.05; **P < 0.01.
Abbreviations: sIgA, secretory IgA; PBS, phosphate-buffered saline; Ags, antigens; ELISA, enzyme-linked immunosorbent assay; SIM, simultaneous; IM, intramuscular; IN, intranasal; SD, standard deviation.
Figure 3 Ags-specific T-cell responses in spleen.
Notes: Splenocytes from immunized mice were seeded into 24-well plates and incubated at 37°C in 5% CO2 for 48 hrs and assayed for Ags-specific CD4+ T-cell response. (A) Ags-specific proliferative responses in splenocytes were induced by different immunization routes. (B) Frequency of CD4+/IFN-γ cells was calculated according to IFCS. (C) Frequency of CD4+/IL-4 cells was calculated according to IFCS. (D) Ags-specific CD4+ T-cell response was determined by intracellular IL-4 and IFN-γ staining. The FACS plots are representative of the mean percentages of 6 mice in each group. Each bar indicates the mean ± SD of 6 mice per group from three independent results. *P < 0.05; **P < 0.01.
Abbreviations: IFCS, intracellular flow cytometry staining; FACS, fluorescence-activated cell sorting; CD4, cluster of differentiation 4; IFN-γ, interferon gamma; IL, interleukin; SI, stimulation index; SD, standard deviation.
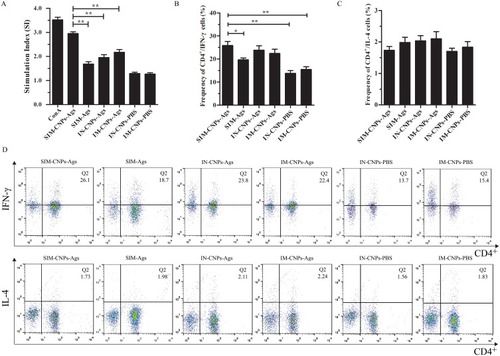
Figure 4 Cytokine secretion by splenocytes from vaccinated mice.
Notes: (A) IFN-γ, (B) IL-2, (C) TNF-α, (D) IL-4, (E) IL-10 and (F) IL-17A levels were measured in the splenocyte supernatants of immunized mice by ELISA kits. Each bar indicates the mean ± SD of triplicates from 6 mice per group. *P < 0.05; **P < 0.01.
Abbreviations: IFN-γ, interferon gamma; IL, interleukin; TNF-α, tumor necrosis factor alpha; ELISA, enzyme-linked immunosorbent assay; Th, helper T; SD, standard deviation.
Figure 5 The burden of C. psittaci in the lungs of immunized mice after the C. psittaci infection.
Notes: The lung homogenates collected from immunized mice 10 days after the C. psittaci challenge were inoculated into HeLa 229 cell monolayers. Then, the chlamydial inclusions were detected by indirect immunofluorescence. Each bar indicates the mean ± SD of the C. psittaci titers (IFU/lung) in the lung homogenates from 6 mice per group in three independent results. *P < 0.05; **P < 0.01.
Abbreviations: SIM, simultaneous; IM, intramuscular; IN, intranasal; IFU, inclusion-forming units; CNPs, chitosan nanoparticles; PBS, phosphate-buffered saline; SD, standard deviation.
Figure 6 Cytokine levels in the lungs of immunized mice after the C. psittaci challenge.
Notes: (A) IFN-γ, (B) TNF-α, (C) IL-4, (D) IL-6, (E) IL-10 and (F) IL-12 levels were detected in the lung homogenates of immunized mice by ELISA kits after the C. psittaci infection. Each bar represents the mean ± SD of the cytokine levels (pg/mL) in the lung homogenates from 6 mice per group in three independent experiments. *P < 0.05; **P < 0.01.
Abbreviations: IFN-γ, interferon gamma; IL, interleukin; TNF-α, tumor necrosis factor alpha; ELISA, enzyme-linked immunosorbent assay; SD, standard deviation.
Figure 7 Histopathological assessment of lung tissues after C. psittaci infection.
Notes: H&E-stained sections of lung tissue from each group of mice (magnification 100× and 400×) are shown as (A) SIM-CNPs-Ags group, (B) SIM-Ags group, (C) IN-CNPs-Ags group, (D) IM-CNPs-Ags group, (E) IN-CNPs-PBS group and (F) IM-CNPs-PBS group.
Abbreviations: H&E, hematoxylin-eosin; SIM, simultaneous; IM, intramuscular; IN, intranasal; CNPs, chitosan nanoparticles; PBS, phosphate-buffered saline.
Figure 8 C. psittaci burden and pathological assessment in lung tissue measured by IHC.
Notes: (A) The infected lungs were sectioned and stained with S-P immunohistochemistry using an UltraSensitive™SP (Rabbit) IHC Kit with rabbit anti-C. psittaci 6BC antibody used as the primary antibody. (a) SIM-CNPs-Ags group, (b) SIM-Ags group, (c) IN-CNPs-Ags group, (d) IM-CNPs-Ags group, (e) IN-CNPs-PBS group and (f) IM-CNPs-PBS group. Brown granules (black arrow) indicate C. psittaci inclusions in the nuclei of the lung tissue cells. (B) C. psittaci positive count per 100× field. (C) C. psittaci positive count per 400× field. Each bar indicates the mean ± SD from three independent experiments. *P < 0.05; **P < 0.01.
Abbreviations: IHC, immunohistochemistry; S-P, streptavidin-peroxidase; SIM, simultaneous; IM, intramuscular; IN, intranasal; CNPs, chitosan nanoparticles; PBS, phosphate-buffered saline.
Figure 9 The dissemination of Chlamydia in vivo.
Notes: C. psittaci burden was evaluated using qPCR to measure C. psittaci DNA concentrations in (A) lung, (B) blood, (C) liver, (D) spleen, and (E) kidney. Points correspond to that separately extracted from each animal. Horizontal lines represent mean values. *P < 0.05; **P < 0.01.
Abbreviations: qPCR, quantitative real-time polymerase chain reaction; SIM, simultaneous; IM, intramuscular; IN, intranasal; CNPs, chitosan nanoparticles; rRNA, ribosomal ribonucleic acid; DNA, deoxyribonucleic acid.