Figures & data
Figure 1 SEM picture of SPIONCitrate. The picture of freeze-dried SPIONCitrate was taken with a Zeiss Auriga SEM (Carl Zeiss, Oberkochen, Germany) with an acceleration voltage of 1.5 kV.
Abbreviations: SPION, superparamagnetic iron oxide nanoparticle; SEM, scanning electron microscope.
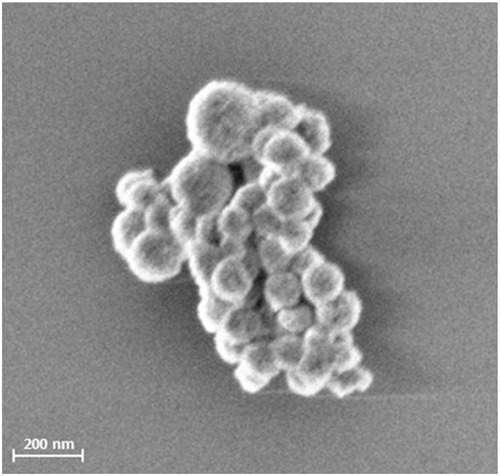
Figure 2 Stability of SPIONCitrate in blood. SPIONCitrate (left) and water used as negative control (right) were stable in EDTA (upper row) and citrate (lower row) anticoagulated blood. Contrary to the aminated particles used as positive control (middle), which aggregated (marked by arrows), SPIONCitrate did not show agglomeration.
Abbreviations: EDTA, ethylenediaminetetraacetic acid; SPION, superparamagnetic iron oxide nanoparticle
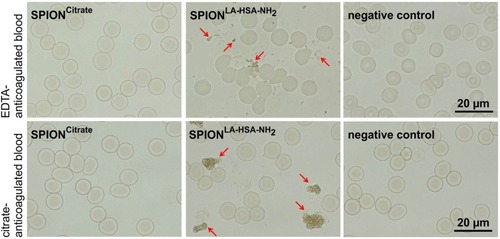
Figure 3 Determination of biocompatibility by flow cytometry. In the beginning, after 24 hrs and after 48 hrs of the incubation of EL4 cells with SPIONCitrate, cells were stained with Hoe to exclude excess particles from analysis and with AxV and PI for detection of apoptotic (AxV+PI-, blue) and necrotic (PI+, red) cells. The results were displayed as percentage of cell count (A) and as relative cell count (B). The experiment was performed in triplicate in at least three independent experiments. The mean values with standard deviations are shown. Numeric data for this figure can be found in supplementary information S2. Significance of viable cells (AxV-PI-) compared to control is represented by asterisks.
Abbreviations: AxV, Annexin A5 FITC conjugate; Hoe, Hoechst 33342; PI, propidium iodide; SPION, superparamagnetic iron oxide nanoparticle.
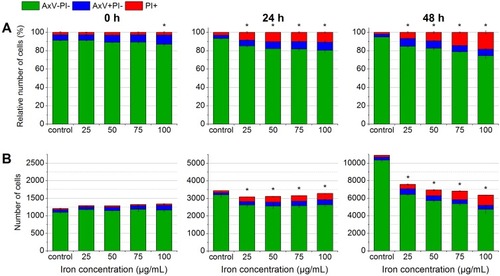
Figure 4 Detection of formation of reactive oxygen species by flow cytometry. To check whether SPIONCitrate leads to the formation of ROS, the EL4 cells were stained with DCFH-DA. When ROS is generated, DCFH is oxidized to DCF, which has a strong fluorescent effect. In the beginning, after 6 hrs, 24 hrs and after 48 hrs of incubation with SPIONCitrate, cells were additionally stained with DiI and PI for detection of viable cells. The results were displayed as relative cell count (A) and as percentage of cell count (B). The experiment was performed in triplicate in at least two independent experiments. The mean values with standard deviations are shown. Significance of stressed cells compared to hydrogen peroxide 1 mM is represented by asterisks.
Abbreviations: DCF, dichlorofluorescein; DCFH, dichlorofluorescin; DCFH-DA, 2′,7′-dichlorofluorescin diacetate; DiI, DiIC1(5) (1,1′-dimethyl-3,3,3′,3′-tetramethylindodicarbocyanine iodide); PI, propidium iodide; ROS, reactive oxygen species; SPION, superparamagnetic iron oxide nanoparticle.
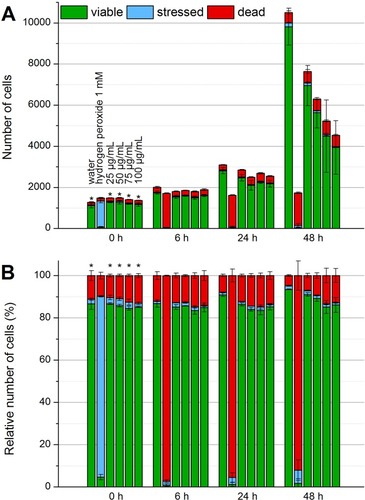
Figure 5 Determination of particle uptake and/or adhesion by flow cytometry. In the beginning, after 24 hrs and after 48 hrs of the incubation of EL4 cells with SPIONCitrate, cells were stained with Hoe to exclude excess particles from analysis and with DiI to detect viable cells with intact mitochondrial membrane potential. (A) Side scatter values of viable cells were analyzed for changes in cell granularity, which occurred with uptake and adhesion of particles. (B) The fluorescent dye LY was added to the cell culture medium before incubation of cells with nanoparticles. During particle uptake into the cell, LY was co-ingested and hence served as a parameter for particle uptake. The experiments shown in this figure were performed in triplicate in at least three independent experiments. The mean values with standard deviations are shown. Significance of treated cells compared to control at the same time point is represented by asterisks.
Abbreviations: DiI, DiIC1(5) (1,1′-dimethyl-3,3,3′,3′-tetramethylindodicarbocyanine iodide); Hoe, Hoechst 33342; LY, Lucifer Yellow; SSc, side scatter; SPION, superparamagnetic iron oxide nanoparticle.
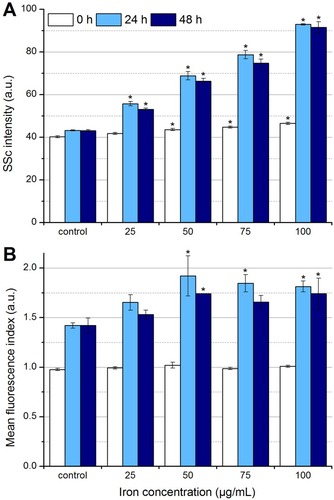
Figure 6 Quantification of SPION uptake into cells. EL4 cells were incubated for 24 hrs with SPIONCitrate at an iron concentration of 75 µg/mL. Cell pellets of purified, unwashed and control cells were counted, lyzed and their iron content measured by AES. The purification process led to a significantly lower amount of iron in the pellet of the washed cells, but these, like the unwashed cells, still contained significantly more iron than the control cells. The experiment shown in this figure was performed in six independent experiments. The mean values with standard deviations are shown. Significances of treated cells compared to control are represented by degree signs (°°p < 0.005), significance of purified cells compared to unwashed cells is represented by number signs (##p < 0.005).
Abbreviations: AES, atomic emission spectroscopy; SPION, superparamagnetic iron oxide nanoparticle.
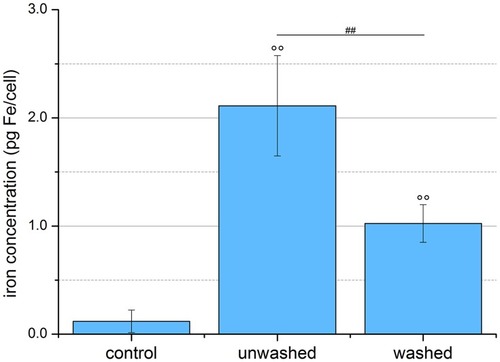
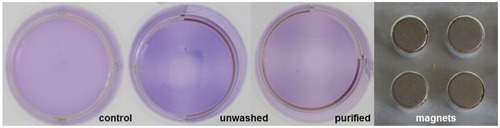
Figure 7 Visualization of magnetic attractability of SPIONCitrate-loaded cells. EL4 cells were incubated for 24 hrs with SPIONCitrate at an iron concentration of 75 µg/mL. Subsequently, purified, unwashed and control cells were stained with crystal violet and incubated for 48 hrs on a magnetic plate (approx. 0.5 T). Loaded cells, whether washed or not, preferably sedimented in the area of the magnets.
Abbreviation: SPION, superparamagnetic iron oxide nanoparticle.