Figures & data
Figure 1 Schematic presentation of nanoparticle preparation, its characterization and in vivo study.
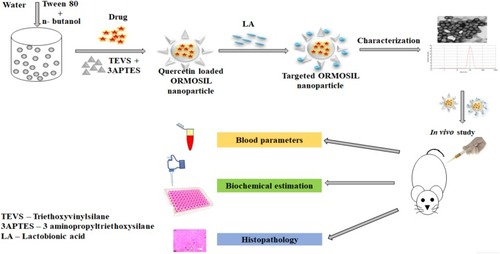
Figure 2 (Left) UV-Visible spectrophotometric data of quercetin, void and nanoparticles. (Right) Images of synthesized nanoparticles (A) Void nanoparticles, (B) Q-ORMOSIL and (C) LA-Q-ORMOSIL.
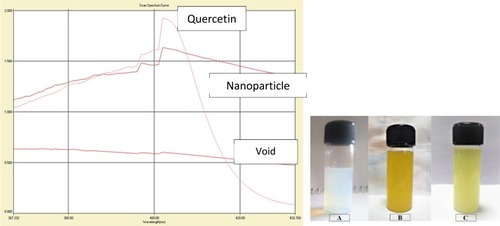
Figure 3 The Fourier transform infrared spectroscopy of (A) LA-Q-ORMOSIL (B) Q-ORMOSIL and (C) quercetin.
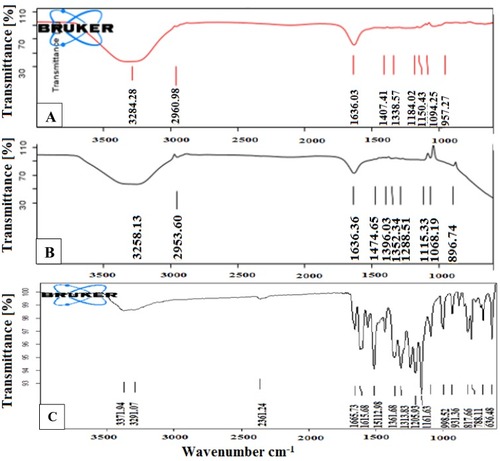
Figure 4 (A) Shows transmission electron microscopy analysis of nanoparticles, (B) represents size distribution of nanoparticles, (C) represents EDX analysis. Powder X ray diffraction.
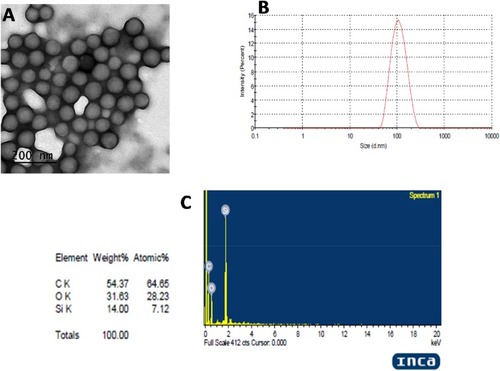
Figure 5 XRD spectra of synthesized ORMOSIL nanoparticles.
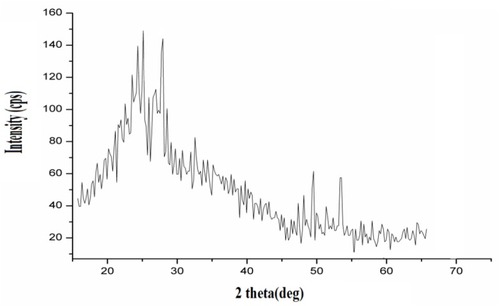
Figure 6 In vitro release study of nanoparticles.
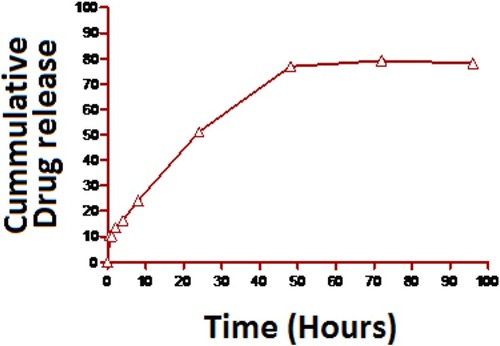
Figure 7 Results represented as mean ± SD. (A) ALT, (B) AST, and (C) ALP. Statistical analysis done by one-way ANOVA followed by Bonferroni’s test and results obtained are significantly different (P <0.05, * vs control group, # vs CP group, @ vs CP + Q group and ($) vs CP + Q-ORMOSIL nanoparticle).
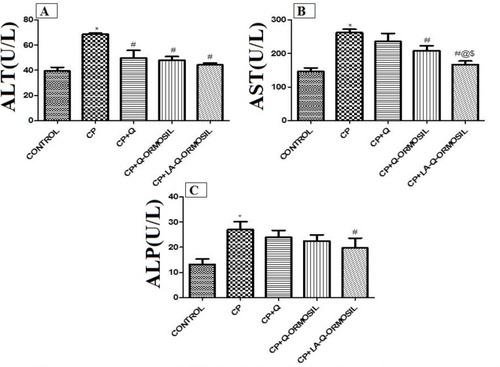
Figure 8 Results represented as mean ± SD (A) ROS and (B) TBARS. Statistical analysis done by one-way ANOVA followed by Bonferroni’s test and results obtained are significantly different (P <0.05, * vs control group, # vs CP group, @ vs CP + Q group and ($) vs CP + Q-ORMOSIL nanoparticle).
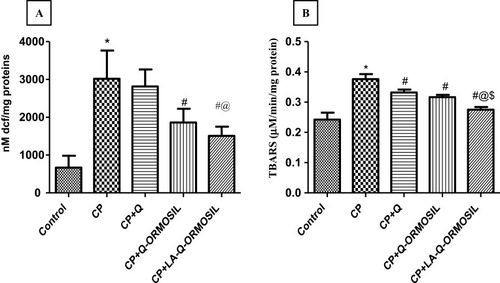
Figure 9 Results represented as mean ± SD. Where (A) SOD, (B) catalase, (C) GSH, and (D) GST. Statistical analysis done by one-way ANOVA followed by Bonferroni’s test and results obtained are significantly different (P <0.05, * vs control group, # vs CP group, @ vs CP + Q group and ($) vs CP + Q-ORMOSIL nanoparticle).
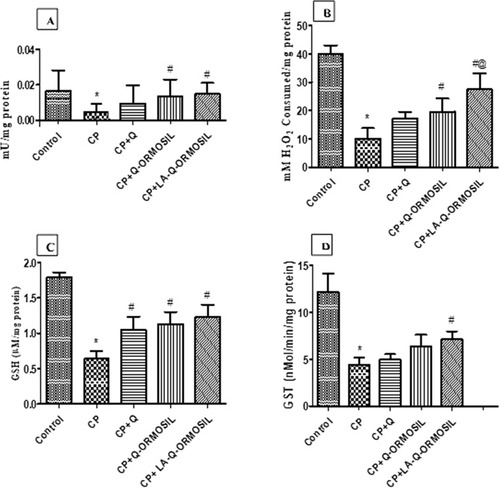
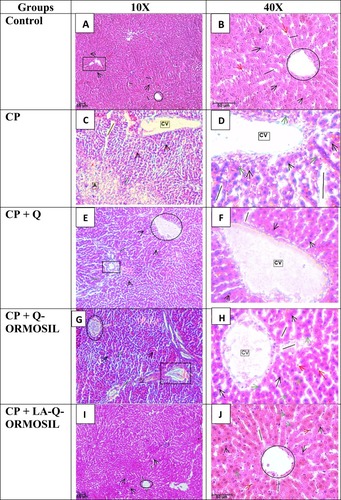
Figure 10 Rat liver histopathology (H&E) from: (A and B) control showing normal architecture of liver cells; (C and D) cyclophosphamide showing dilation and congestion of central vein and sinusoids, neutrophil infiltration, vacuolization of hepatocytes and presence of binucleated hepatocytes; (E and F) CP + Q shows dilation and congestion of central vein and sinusoids; (G–J) CP+ Q-ORMOSIL and CP+ LA-Q-ORMOSIL shows marked improvement in liver cells.