Figures & data
Table 1 The specific primer pairs for COX-2, PCNA, and GAPDH with accession number
Figure 1 (A) TEM and SEM images of different ETD nanoformulations; (a) N-Phsoms, (b) P-Phsoms, (c) NLCs, and (d) AlgNPs. TEM images was at 7500× and scale bar is 100 nm. While SEM images were at 7500× magnification power and scale bar is 1 µm. (B) DSC thermograms of Mannitol, ETD, N-Phsoms, P-Phsoms, NLCs, and AlgNPs.
Abbreviations: ETD, Etodolac; NLC, nanostructured lipid carriers; TEM, transmission electron microscope; SEM, scanning electron microscope; AlgNPs, alginate nanoparticles; DSC, differential scanning calorimeter.
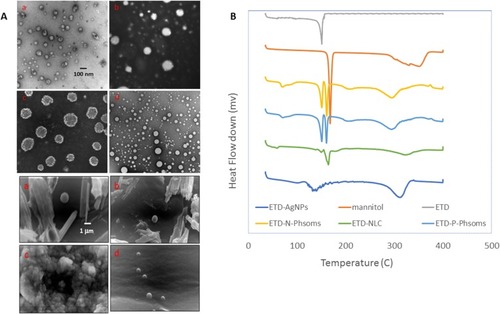
Table 2 The average diameter of the formulations (nm), PDI value, zeta-potential (mV), percentage entrapment efficiency (EE%)
Figure 2 (A) In-vitro release profiles of N-Phsoms, P-Phsoms, NLCs, and AlgNPs in PBS (pH 7.4) using Franz diffusion technique for 24 hrs at 32°C and 75 rpm. (B) Ex-vivo cumulative amount (μg/cm2)-time profiles of ETD permeated from N-Phsoms, P-Phsoms, NLCs, and AlgNPs systems across human abdominal skin using Franz diffusion test over 24 hrs. (C) Amount of ETD retained (μg/cm2) in St.C, Epidermis and dermis, and in receiver chamber after 24 hrs of experiment. Each value represents the mean ± SD (n=3).
Abbreviations: NLCs, nanostructured lipid carriers; AlgNPs, alginate nanoparticles; PBS, phosphate buffer saline; ETD, etodolac; St.c, stratum corneum.
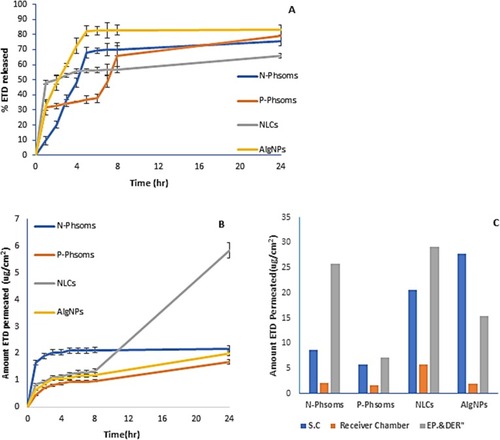
Table 3 Permeation kinetic parameters of N-Phosoms, P-Phsoms, NLCs, and AlgNPs through abdominal human skin
Figure 3 (A) CLSM images of a cross-section of human abdominal skin incubated on a Franz diffusion cell with different formulations containing ETD. The nanocarriers were applied for 6 hrs non-occlusively: (a) N-Phsoms, (b) P-Phsoms, (c) NLCs, and (d) AlgNPs. (B) Bar chart represents the fluorescence intensity (Pixels/µm2) of all nanoformulations at different depth intervals (0–100, 100–200, and 200–300 µm2). (C) Overlay of blue fluorescence of DAPI, bright-field image, and red fluorescence of fluorescent dye (Rhodamine B). (D) Light microscopy images of human skin samples (stained with hematoxylin and eosin) after 24 hrs of treatment 1% ETD nanoformulations: (a) control group (untreated skin); (b) N-Phsoms; (c) P-Phsoms; (d) NLCs; and (e) AlgNPs. Letters S, P, and M refer to stratum corneum, epidermis, and dermis, respectively.
Abbreviations: NLCs, nanostructured lipid carriers; AlgNPs, alginate nanoparticles; CLSM, confocal laser scanning microscopy; ETD, etodolac; St.c, stratum corneum; DAPI, 4, 6-diamidino-2-phenylindole.
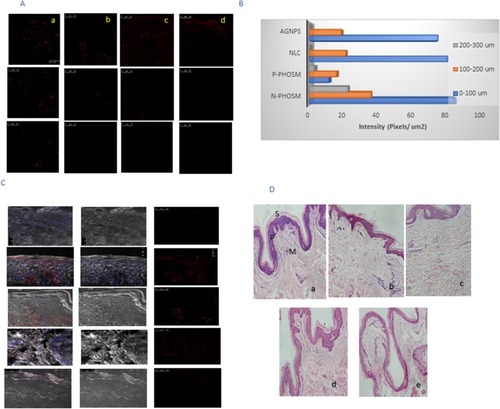
Figure 4 (A) Percent viability of SCC-9 skin cancer cell measured by MTT cytotoxicity assay after exposure to ascending concentrations of free ETD solution, ETD-loaded N-Phsoms, P-Phsoms, NLCs, and AlgNPs for 24 hrs, data were shown as mean ± SD (n=3), P<0.05. (B) Images acquired during a wound-healing experiment, (parts A&D) are for control untreated SCC, (parts B&E) are for SCC treated with Free ETD drug, (parts C&F) for SCC treated with ETD-loaded N-Phsoms formulation at the time t=0 and T=24 hrs. (C) Bar chart of % cell migration inhibition of control untreated SCC, SCC treated with Free ETD drug, and ETD- loaded N-Phsoms formulation after 24 hrs.
Abbreviations: ETD, etodolac; NLCs, nanostructured lipid carriers; AlgNPs, alginate nanoparticles; SCC, squamous cell carcinoma.
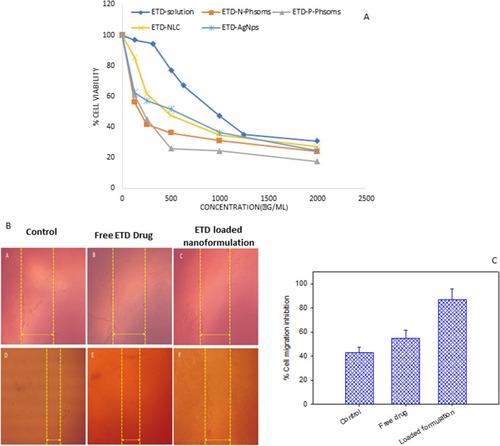
Table 4 IC50 values of ETD-loaded N-Phsoms, P-Phsoms, NLCs, and AlgNPs compared to free ETD solution on SCC-9 skin cancer cells after 24 hrs
Figure 5 (A) Animals’ body weight measurements (g) during ETD treatment. (B) Animals’ relative organ weight (%) after ETD treatment. (C) Relative tumor weight after ETD treatment. (D) Effect of ETD on tumor COX-2 mRNA expression. (E) Effect of ETD on tumor PCNA mRNA expression. (F) Effect of ETD on tumor Caspase 3 activity. *P˂0.05 vs positive control, #P˂0.05 vs ETD nano.
Abbreviations: ETD, etodolac; PCNA, proliferating cell nuclear antigen.
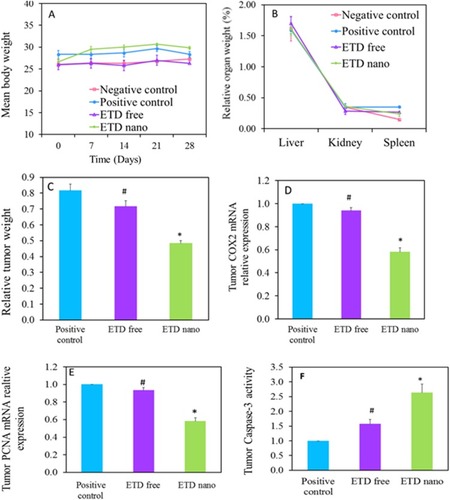
Table 5 Effect of ETD treatment on serum liver and kidney functions
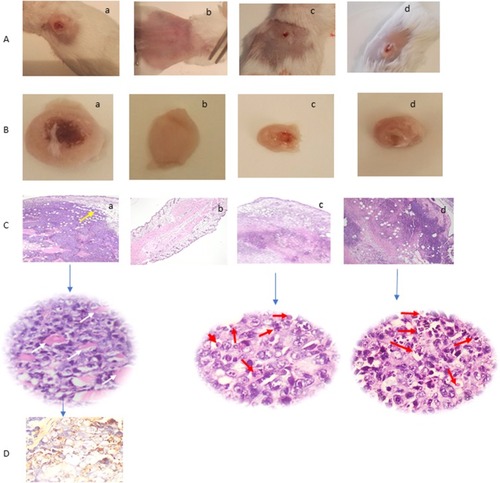
Figure 6 (A) Tumor-bearing mice. (B) Excised tumors. (C) H&E histopathological examination of tumor tissue sections at the end of study period using two magnification powers ×200 and 400 original magnification. (D) Immunohistochemical staining of tumor tissue shows focal and strong positive staining of the malignant cells to Multi-Cytokeratin AE1/AE3 (Ready to use primary antibody, Mouse anti-human, monoclonal antibody, P0012, Bond-Max fully automated immunostainer, Leica Biosystems, USA). For the following groups, (a) untreated (positive control) tumor infiltrating the dermis, subcutaneous, and muscular tissues (yellow arrow). The tumor is formed of masses of malignant cells with pleomorphism, hyperchromatism, vesicular nuclei, and prominent nucleoli with frequent tumor giant cells (white arrow), (b) Normal (Negative control), (c) ETD Nanoformulation treated (red arrows point to apoptotic cells and apoptotic debris), and (d) ETD solution treated (red arrows point to apoptotic cells and apoptotic debris).
Abbreviations: H&E, hematoxylin and eosin; ETD, etodolac.