Figures & data
Figure 1 Characterization of exosomes: the representative TEM image of blank exosome (A) and exosome-doxorubicin (B). Size distributions of blank exosome (C) and exosome-doxorubicin (D) based on NTA measurements. The peak diameters were at 112.4 nm for free exosome and 152.7 nm for exosome-doxorubicin. (E) Particle size by nanoparticle tracking analysis for MSCs-derived exosomes during storage at −20 °C.
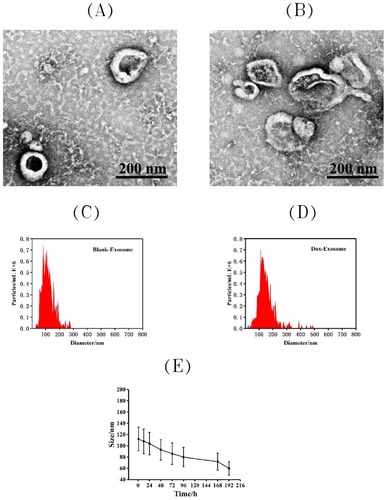
Figure 2 Drug release profile of Exosome-Doxorubicin in PBS with pH4.5 and pH 7.4, respectively.
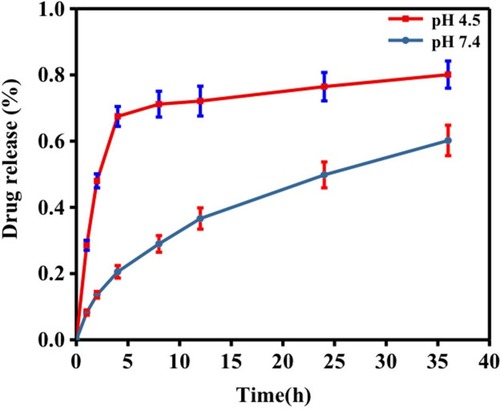
Figure 3 Intracellular distribution of Dox (A) and Exo-DOX (B) after 1 hrs, 4 hrs and 24 hrs incubation with MG63 cells, bar was 50μm. The histogram (C) and Quantification (D) of internalized Dox, Exo-Dox using flow cytometry after incubation with MG63cells for 1 h,4 h and 24 h. All of the data are presented as mean±s.d. (n=3) and analyzed with two-way ANOVA (****P < 0.0001).
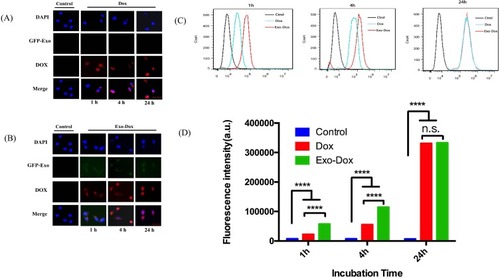
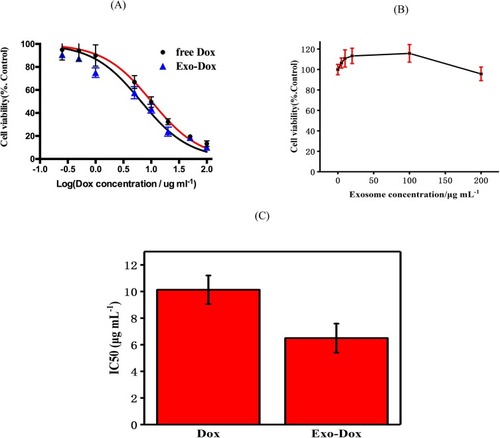
Figure 4 Cell viability of MG63 cells exposed to different concentrations of free doxorubicin, exosome-doxorubicin (A) and blank exosome (B). The IC50 of free doxorubicin and exosome-doxorubicin (C), where the value was calculated according to Figure A.