Figures & data

Figure 1 Production of therapeutic MP-AuNPs through Green Nanotechnology.
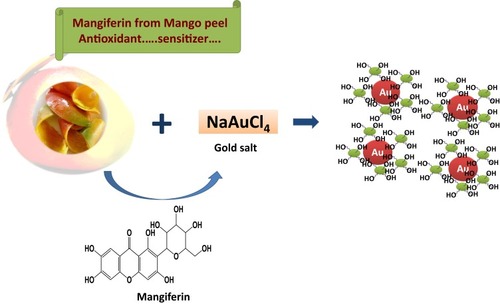
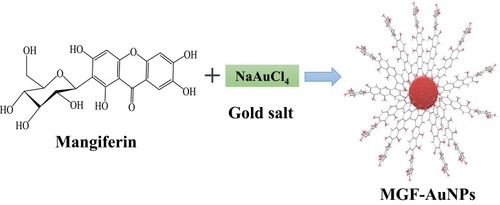
Figure 2 Production of therapeutic MGF-AuNPs through Green Nanotechnology.
Scheme 1 Gold nanoparticle phytochemicals incorporated 'Nano Swarna Bhasma' (NSB) formulation using proprietary amounts of phytochemicals from Amalaki (Emblica officinalis), Amra (Mangifera indica), Haridra (Curcumin longa), Babbula (Acacia nilotica), and Yashtimadhu (Glycyrrhiza glabra).
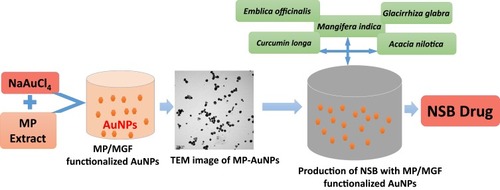
Table 1 Physicochemical Data Parameters of Gold Nanoparticles (AuNPs)
Figure 3 Characterization of AuNPs by UV-Visible spectrum and TEM techniques (A) MP-AuNPs, (B) MGF-AuNPs.
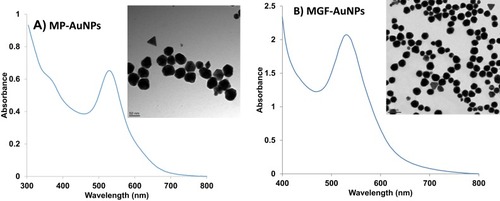
Figure 4 (A) Core size distribution of AuNPs in 'Nano Swarna Bhasma' (NSB) drug by TEM, (B) STEM image shows lattice structure of Au, (C) Graph shows presence of Au in NSB drug by EELS.
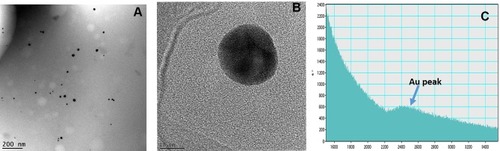
Figure 5 Pie chart represents polyphenols and various phytochemical compounds in mango peel (mg/Kg) on dry matter basis.
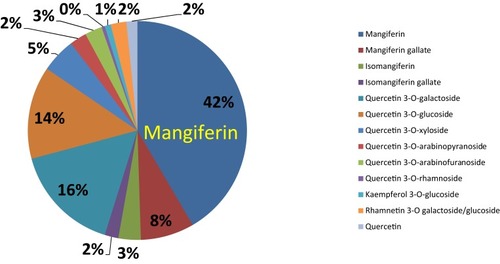
Figure 6 Effect of NSB drug on breast cancer (MDA-MB-231) cells viability and non-toxic nature on normal endothelial (HAECs) cells.
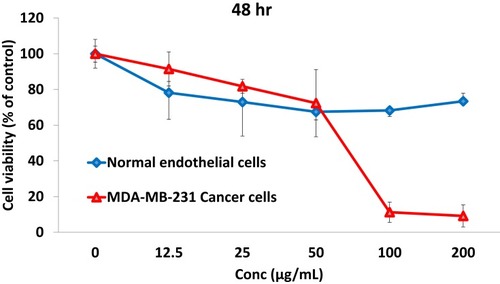
Figure 7 Therapeutic effects of NSB drug to control or reduce tumor size in human breast tumor bearing SCID female mice. Animals randomized and treated orally on day zero. Treatment was given twice per week; n=7.
Note: Untreated control group represents no treatment, only tumor bearing SCID mice.
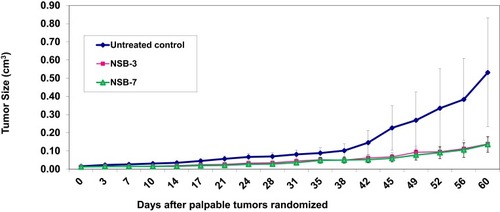
Figure 8 Effect of NSB drug on body weight of SCID mice after oral administration in human breast cancer bearing SCID mice.
Note: Untreated control group represents no treatment, only tumor bearing SCID mice, and control group represents no treatment and no tumor bearing mice (healthy control mice).
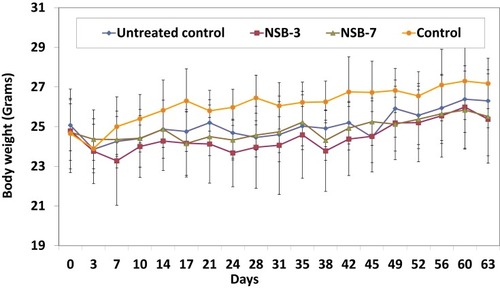
Table 2 Summary of Overall, Target and Non-Target Lesion Response at Week 12 by Treatment
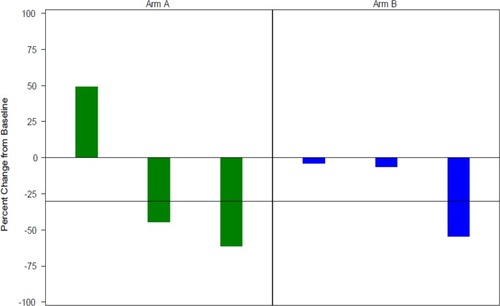
Figure 9 Waterfall plot for percent change from baseline in tumor’s sum of longest diameter at week 12 by treatment.
Notes: Patients in treatment arm A received the following- Doxorubicin (60 mg/m2 every 3 weeks as a 1 hr intravenous infusion) and Cyclophosphamide (600 mg/m2 every 3 weeks as a 1 hr intravenous infusion). Patients in treatment arm B received the following- Doxorubicin (60 mg/m2 every 3 weeks as a 1 hr intravenous infusion), Cyclophosphamide (600 mg/m2 every 3 weeks as a 1 hr intravenous infusion) and NSB Drug– two capsules thrice a day after food.