Figures & data
Figure 1 HE staining and SEM micrographs of CS/HA (left) and Sa B-CS/HA (right).
Notes: HE ×40, bar 250 μm; SEM ×300, bar 100 μm.
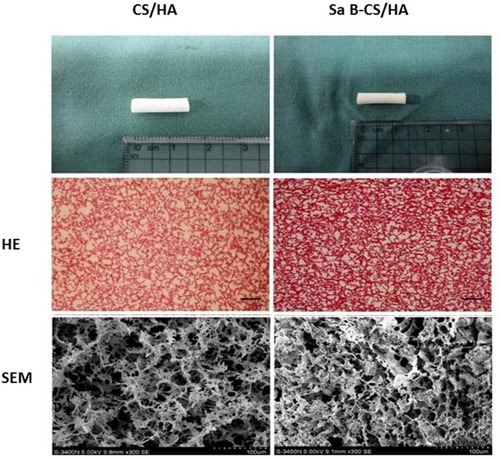
Figure 2 FTIR spectra of pure salvianolic acid B (A), CS/HA (B) and Sa B-CS/HA (C).
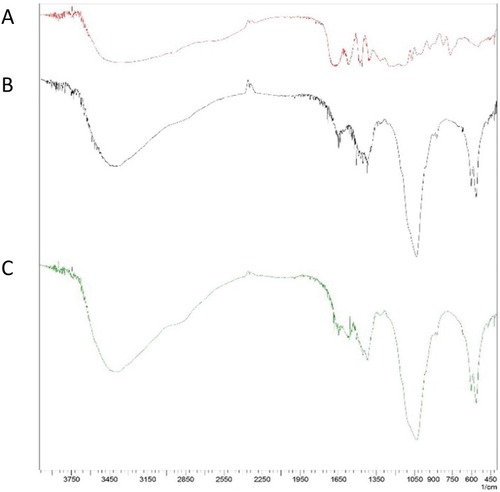
Figure 3 Release behavior of salvianolic acid B from Sa B-CS/HA scaffold in vitro for 8 weeks.
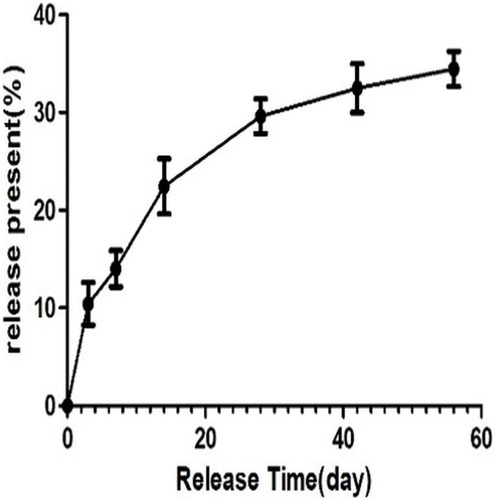
Table 1 Morphology And Mechanical Properties
Figure 4 Surface morphology of MC3T3-E1 cells cultured in CS/HA (left) and Sa B-CS/HA scaffolds (right).
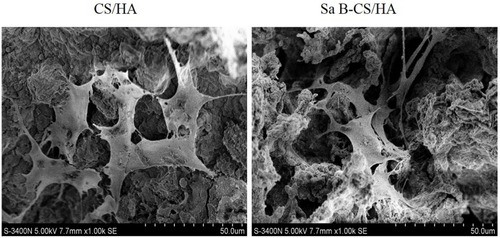
Figure 5 Proliferation of MC3T3-E1 cells in CS/HA and Sa B-CS/HA groups at 3 and 5 days.
Notes: Values represent the mean of 3 times in each group (mean ± SD). *Significant difference between the values of Sa B-CS/HA group and CS/HA group (P<0.05).
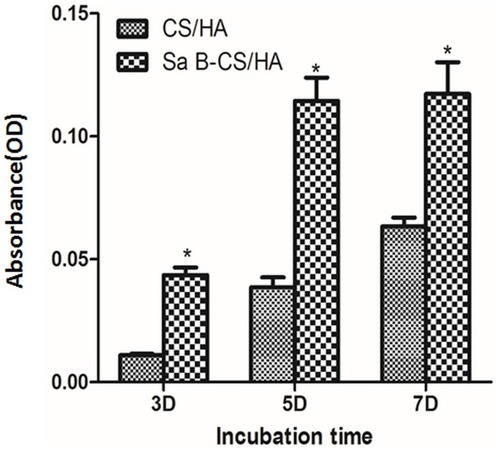
Figure 6 Proliferation of HUVEC in CS/HA and Sa B-CS/HA groups at 1 and 3 days..
Notes: Values represent the mean of 3 times in each group (mean ± SD). *Significant difference between the values of Sa B-CS/HA group and CS/HA group (P<0.05).
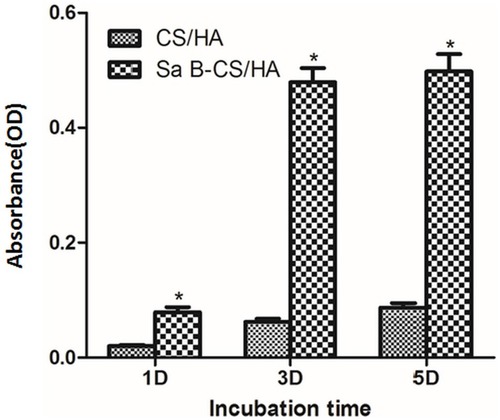
Figure 7 ALP activity of MC3T3-E1 cells cultured in CS/HA and Sa B-CS/HA groups at 7 and 14 days.
Notes: Values represent the mean of 3 times in each group (mean ± SD). *Significant difference between the values of Sa B-CS/HA group and CS/HA group (P<0.05).
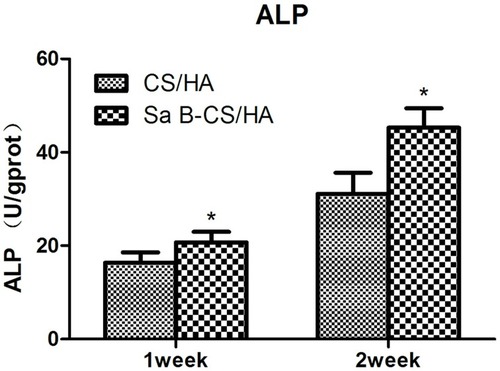
Figure 8 VEGF activity of HUVEC cultured in CS/HA and Sa B-CS/HA groups at 1 and 3 days..
Notes: Values represent the mean of 3 times in each group (mean ± SD). *Significant difference between the values of Sa B-CS/HA group and CS/HA group (P<0.05).
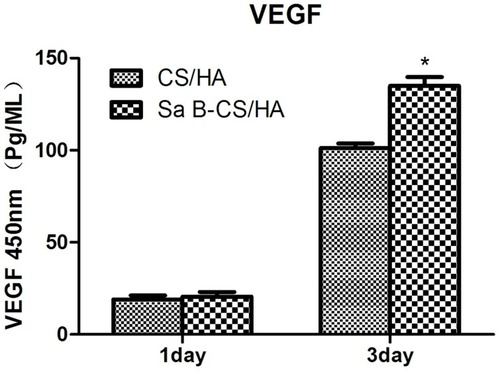
Figure 9 Surgery process of the rabbit model.
Notes: (A) Longitudinal incision was made at the radius of the anterior limb to expose the radius under general anesthesia. (B) A radius osteotomy of 1.5 cm length was performed in the middle shaft of the radius and the ulna was retained to avoid the fracture of limb. (C) The Sa B-CS/HA scaffolds or CS/HA scaffolds were imbedded into the defect site. (D) All incisions were closed using nonabsorbable sutures.
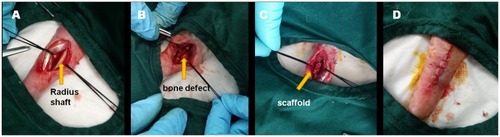
Figure 10 CT images and analysis of new bone formation.
Notes: (A) After 6 weeks and 12 weeks, Group Sa B-CS/HA exhibited significant bone formation and most of the defect area was filled with whole bone cortex while the bone defect was still obvious in Group CS/HA. (B) Bone volume ratio (BV/TV) was significantly higher in Group Sa B-CS/HA compared with control group (p<0.05).
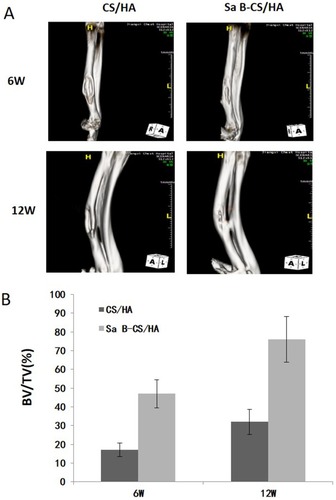
Figure 11 Histological images and histomorphometric analysis of bone formation.
Notes: (A) Histological micrographs of sections upon HE staining. After 6 and 12 weeks, although bone cortex began to form in Group CS/HA, the process proceeded slowly. Group Sa B-CS/HA led to a better result with complete bone cortex regeneration. (B) Histomorphometric analysis. After 6 weeks, the percentage of bone formation in the initial defect site in Group CS/HA was higher than in Group Sa B-CS/HA. the percentage of bone formation was significantly higher in Group Sa B-CS/HA compared with Group CS/HA (p<0.05).
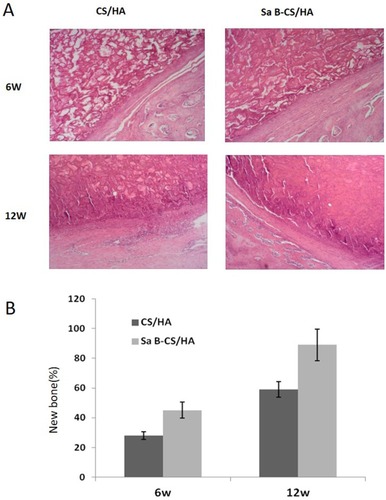
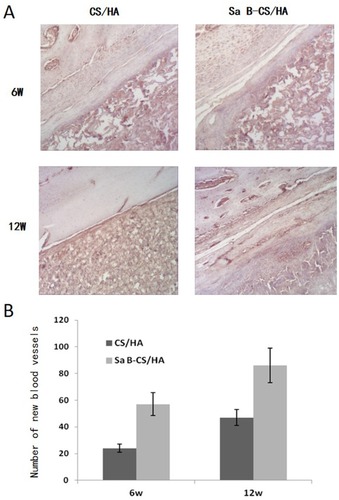
Figure 12 Results of immunohistochemistry conducted at decalcified samples.
Notes: (A) Representative images of immunohistochemical staining of CD34. (B) CD34 was found expressed in vascular endothelial cell, with significant increases in both the size and area of vessels in Group Sa B-CS/HA compared with Group CS/HA (p<0.05).