Figures & data
Figure 1 PDA-assisted treatment-enhanced biofilm removal. (A) Biofilm biomass measured by crystal violet assay (data = mean ± standard error of the mean, n=5, *p<0.05, **p<0.001). (B) Representative confocal laser scanning microscopy images of samples after the treatments (bacteria appeared green) and associated biofilm thickness.
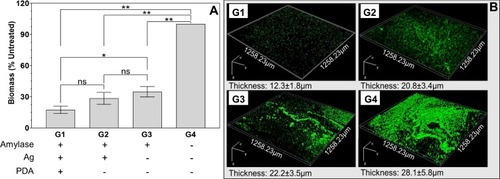
Figure 2 PDA-assisted treatment had higher bacteria killing. (A) Colony-forming units (CFU, log scale) recovered from the substrates after the treatment (data = mean ± standard error of the mean, n=5, *p<0.05, **p<0.001). (B) Representative SEM images of the sample surface after the treatments.
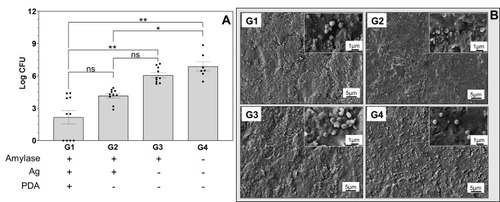
Figure 3 PDA-assisted treatment rendered the surface antimicrobial. (A): Procedure of the tests. (B): Regrowth of bacteria from treated samples monitored by OD measurement (data = mean ± standard error of the mean, n=2). (C): Significant lower log CFU on G1 compared to Ti control. (data = mean ± standard error of the mean, n=3). *p<0.05, **p<0.001. (D): Photographs showing the turbidity of the broth indicating bacterial growth except for the G1 group.
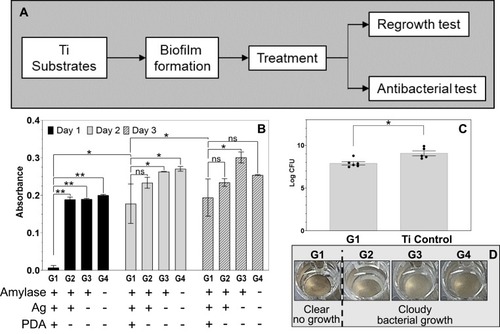
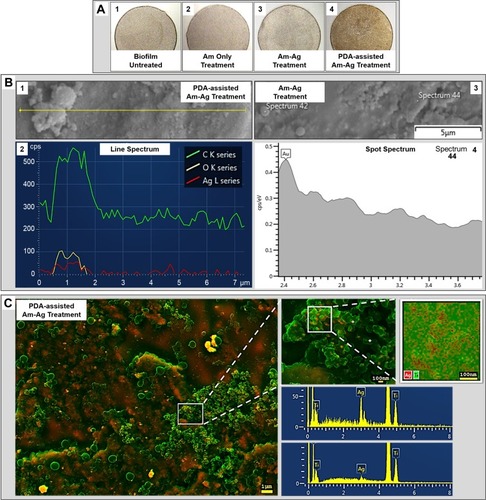
Figure 4 PDA-assisted treatment immobilized the silver particles onto the substrate’s surface. (A): Gross appearance of samples showing clear visual color changes in the PDA-assisted treatment group. (B): EDX analysis of Am-Ag treatment and PDA-assisted Am-Ag treatment. B1-2: Line analysis on the PDA-assisted treatment sample shows a clear association of Ag (red Ag spectrum line) with bacteria (C and O lines). B3-4: Point analysis on Am-Ag treatment showing no detectable Ag peaks. (C): A representative pseudo-color merged secondary electron (SE, assigned green color) and backscatter electron (BSE, assigned red color) image showing the distribution of immobilized Ag particles (appeared in bright yellow) in PDA-assisted treatment group. EDX spot analysis and mapping, confirming the presence of Ag and its distribution.