Figures & data
Table 1 Ingredients And Physicochemical Characteristics Of The Prepared NPs
Figure 1 Direct contact test of PE sealer, PE nanosealer and AH plus on (A) Streptococcus mutans and (B) Candida albicans with positive microbial growth and negative control; media only.
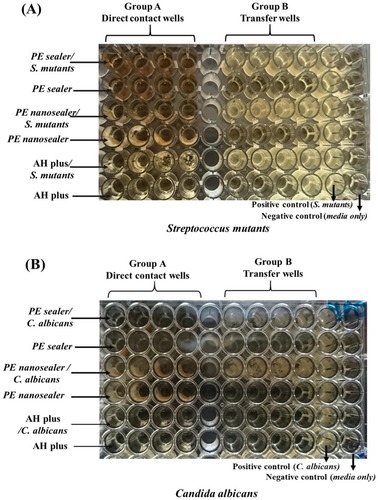
Figure 2 GC-MS of ProE.
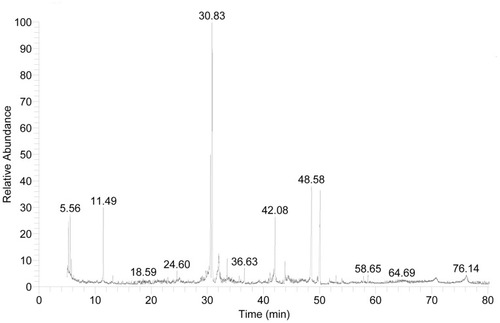
Table 2 Chemical Composition Assessed By GC/MS Analysis Of Pure ProE
Figure 3 SEM micrographs comparing different batches of NPs; (A) NP2, (B) Cryoprotected NP2, (C) NP5 and (D) Cryoprotected NP5.
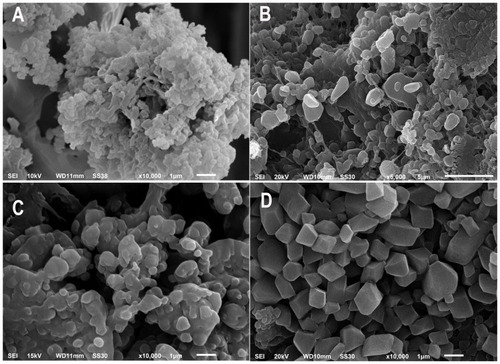
Figure 4 TEM micrographs comparing different batches of NPs; (A) NP2, (B) Cryoprotected NP2, (C) NP5 and (D) Cryoprotected NP5.
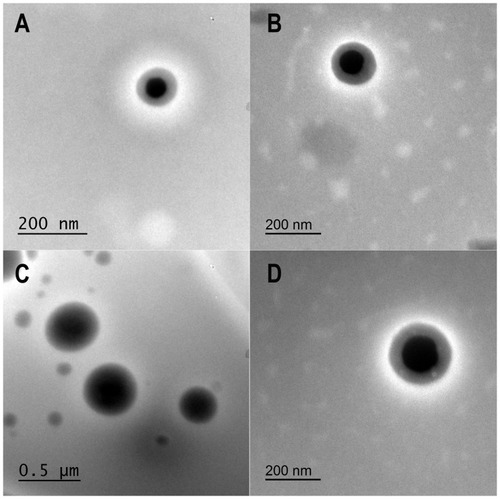
Figure 5 FT-IR spectra of pure ProE (A), PLGA (B), PVA (C), NP2 (D), NP5 (E) and trehalose (F).
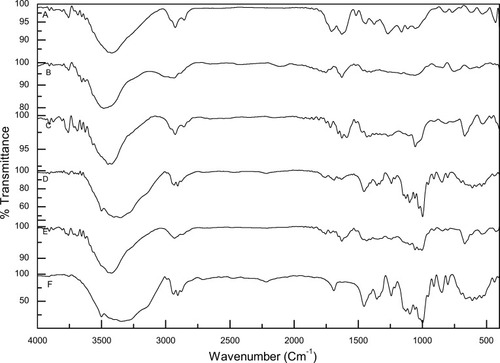
Figure 6 DSC thermograms of pure ProE (A), PLGA (B), PVA (C), NP2 (D), NP5 (E) and trehalose (F).
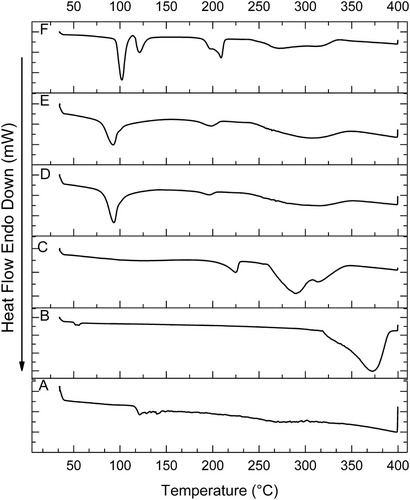
Figure 7 The in vitro release profiles of ProE from the prepared NPs and free ProE.
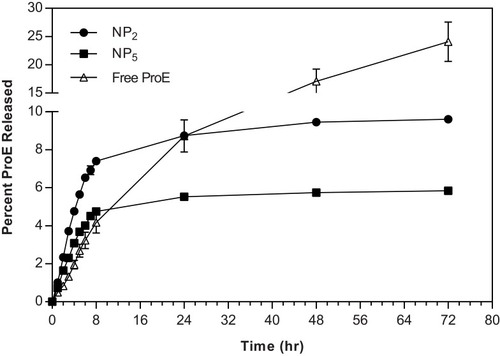
Table 3 Mathematical Modeling And Release Kinetics Of ProE From The Prepared NPs
Figure 8 The in vitro cytotoxicity estimated as percent cell viability after 48 hr.
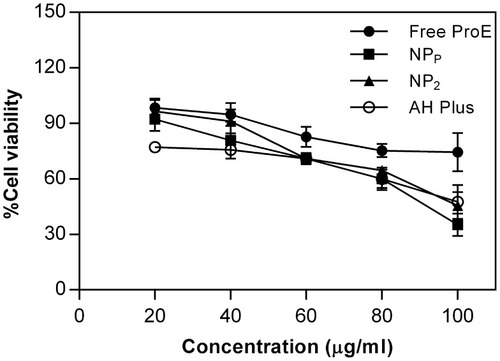
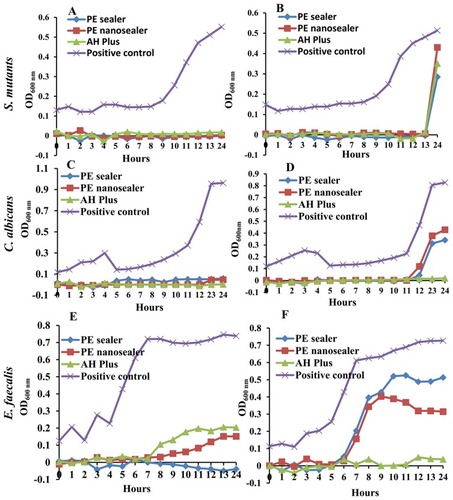
Figure 9 Turbidimetric reading of the direct contact test (DCT) of PE sealer, PE nanosealer and AH Plus® (A and B) Microbial growth of Streptococcus mutans in presence and absence of tested sealers, respectively (C and D) Microbial growth of Candida albicans in presence and absence of tested sealers, respectively (E and F) Microbial growth of Enterococcus faecalis in presence and absence in presence and absence of tested sealers, respectively.