Figures & data
Figure 1 Synthesis of characterization of TPP-PEG-PE copolymer. (A) The 1H NMR spectrum of (a) TPP and (b) TPP-PEG-PE copolymer. (B) FT-IR analysis of (c) TPP, (d) NH2-PEG-PE, and (e) TPP-PEG-PE. The red arrows point out the typical functional groups of above-mentioned three compounds, TPP-PEG-PE is synthesized from the combination of TPP and NH2-PEG-PE with the amide-bond. The peaks of 755.10−1 cm, 690.84 cm−1, 755.81 cm−1 and 690.03−1indictaed by the red arrowsrepresent the aromatic ring characteristic peaks of TPP and the TPP-PEG-PE, respectiveley. The peaks of 1652.82 cm−1indicated by the red arrows represents the amide-bond at the spectra of TPP-PEG-PE.
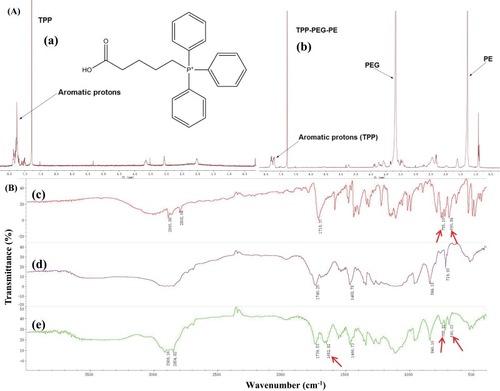
Figure 2 Characterization of PUE@TPP/PEG-PE micelles. (A) TEM photographs. (B) Size and (C) zeta potential distribution of PUE@PEG-PE and PUE@TPP-PEG-PE micelles.
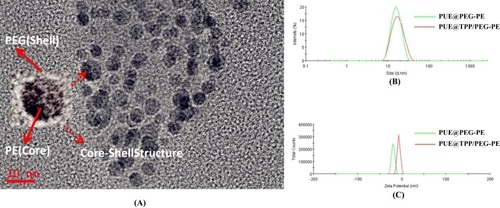
Figure 3 In vitro release curve of free PUE, PUE@PEG-PE, and PUE@TPP/PEG-PE micelles in PBS (pH = 7.4) at 37°C.
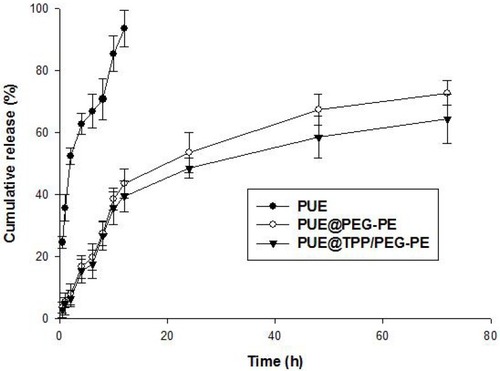
Figure 4 Fluorescent images for qualitative cellular uptake of free C6, C6@PEG-PE, and C6@TPP/PEG-PE micelles incubation in H9c2 cells at 1 and 4 hrs (A). H9c2 cells were incubated with free C6, C6@PEG-PE, and C6@TPP/PEG-PE micelles and the intracellular fluorescence intensity was measured by flow cytometry (B). (a) Quantification of cellular uptake after incubation with free C6, C6@PEG-PE, and C6@TPP/PEG-PE micelles for 1 and 4 hrs. (b) Intracellular fluorescence intensity after treated with free C6, C6@PEG-PE, and C6@TPP/PEG-PE micelles for 4 hrs. Data were expressed as the mean ± SEM from triplicate determinations. *p <0.05, **p <0.01
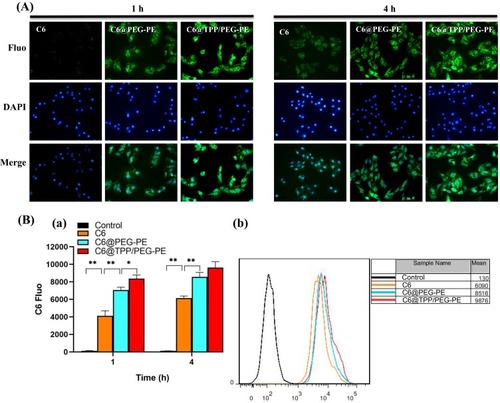
Figure 5 CLSM images of H9c2 cells incubated with C6@PEG-PE and C6@TPP/PEG-PE micelles for 1 and 4 hrs (Green: C6, Red: Mitotracker red stained mitochondria, Blue: Hoechst 33342 stained nuclei).
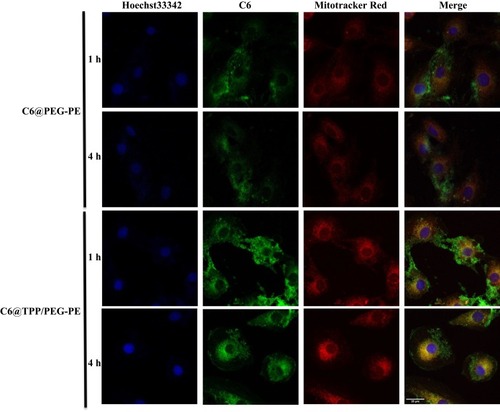
Figure 6 CLSM images of H9c2 cells incubated with C6@PEG-PE and C6@TPP/PEG-PE micelles for 1 and 4 hrs (Green: C6, Red: Lysotracker red stained with lysosomes, Blue: Hoechst 33342 stained nuclei).
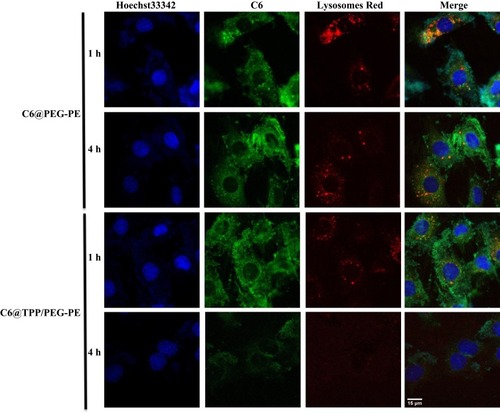
Figure 7 Protective effect of free PUE, PUE@PEG-PE, and PUE@TPP/PEG-PE micelles against ISO-induced H9c2 cell apoptosis. (A) Representative flow cytometric graphs of H9c2 cells after stained with Annexin V-FITC/PI-labeled. (B) ROS level. (C) Caspase-3 activity. (D) The percentage of apoptotic cells. (E) Apoptosis-related protein (Bcl-2 and Bax) expression. Data are mean ± SEM (n = 3) (*p <0.05, **p <0.01).
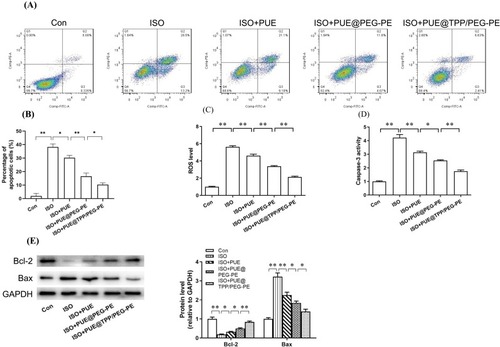
Figure 8 Representative echocardiography (A) and microscopic images of H&E staining of myocardial tissue sections (B) from the control group and the model of the ISO-induced myocardial ischemia group. **p<0.01.

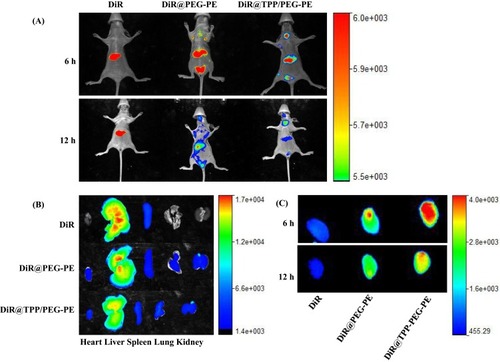
Figure 9 In vivo real-time imaging of ISO-induced myocardial infarction model mice administrated with free DiR, DiR@PEG-PE, and DiR@TPP/PEG-PE micelles (A); Ex vivo optical images of the major organs (heart, liver, spleen, lung, and kidney), which were taken after the mice were sacrificed at 12-hr post injection (B). Ex vivo optical images of the heart which were taken after the mice were sacrificed at 6 and 12 hrs after injection (C).