Figures & data
Figure 1 Synthesis scheme of MPGds contrast agent (A) and application in MRI/PAI dual-modal imaging for orthotopic HCC (B).
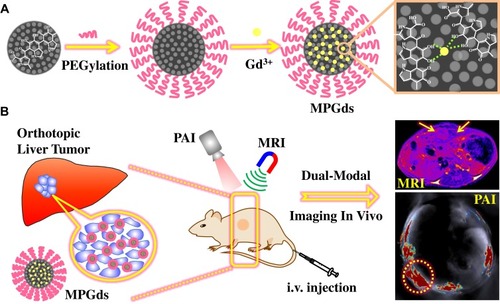
Figure 2 Characterization of MPGds. (A) TEM images of MPGds. (B) DLS results of MPGds dispersed in PBS. (C) The stability curves of MPGds in neutral and weak acidic pH values. (D) UV-Vis-NIR absorbance spectra of MPGds with various concentrations.
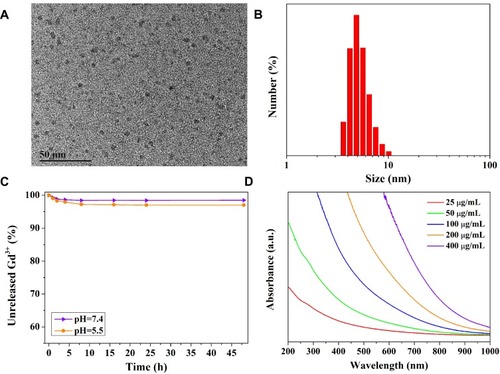
Figure 3 In vitro cell experiments. (A) Relative cell viability by CCK-8 assay of HepG2 and NIH3T3 cells incubated with different concentrations of MPGds for 24 hrs. (B) Bio-TEM image of HepG2 cells incubated with MPGds at 200 μg/mL for 6 hrs (scale bar =1 μm) and the nanoparticles can be seen in the organelle from magnified image in dotted box (yellow arrows). (C) CLSM images of MPGds in vitro. FITC-labeled MPGds (green) in the cytoplasm, cell nuclei (stained by DAPI, blue) and merged image. Scale bar: 50 μm. (D) Representative flow cytometric analysis of HepG2 cells before and after incubation with FITC-labelled MPGds at 200 μg/mL for 6 hrs. The mean fluorescence intensity (MFI) values was listed: 11.62 for control and 180.71 for FITC-labeled MPGds.
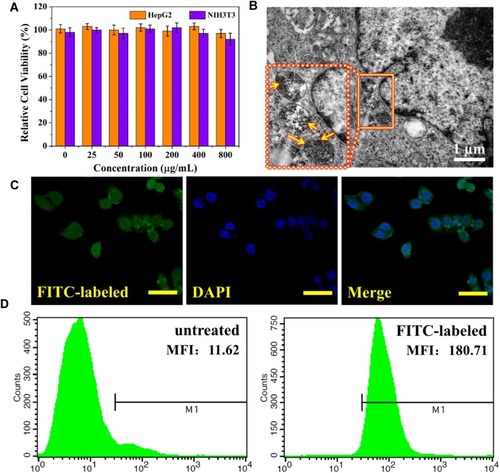
Figure 4 In vitro MR and PA imaging studies of MPGds. T1-weighted MR images (A) and relaxivity measurements (B) of MPGds and Gadodiamide with different Gd3+ concentrations (0.0125, 0.025, 0.05, 0.1, 0.2, 0.4 and 0.8 mM). The T1 relaxation rate as a function of Gd3+ concentrations. The measurements were performed on a 3.0 T MRI scanner at 35°C. (C) PA images of MPGds at various concentrations (12.5, 25, 50, 100, 200, 400 and 800 µg/mL). (D) PA signal intensity as a function of MPGds concentration using an MSOT imaging system. Inset: linear fitting data of PA signal intensity with various MNP concentrations.
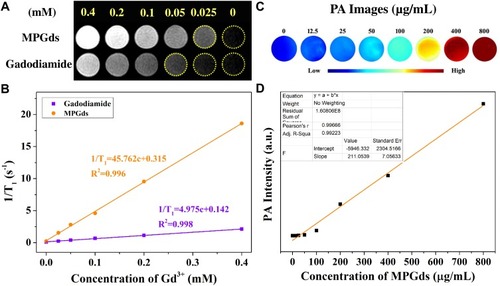
Figure 5 In vivo MR and PA imaging studies of MPGds. (A) T1-weighted MR axial images and the corresponding data analysis of MR measurements of tumor-bearing mice before (pre) and at various time points (0.5 hr, 1 hr, 4.5 hrs, 7 hrs, 24 hrs, 72 hrs and 168 hrs) after injection of MPGds using 3.0 T clinical MRI equipment. The purple arrows point the tumor sites and the orange arrows point the liver. (B) PA images and the corresponding PA signal intensities in the tumor region collected by the MOST imaging system before (pre) and at various time points (0.5 hr, 2 hrs, 4 hrs, 7 hrs, 24 hrs, 72 hrs, and 168 hrs) after injection of MPGds. The green arrows point the liver and the yellow circles point the orthotopic tumor sites. Error bars mean standard deviations (n = 4).
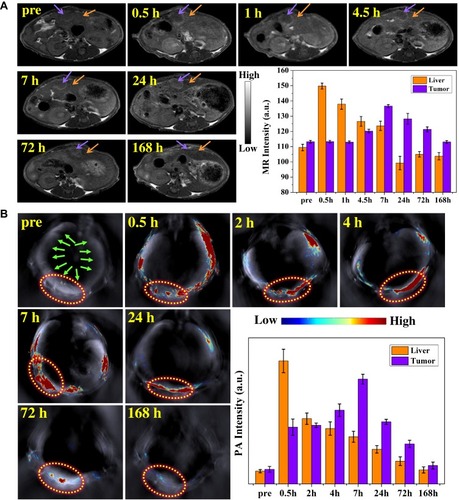
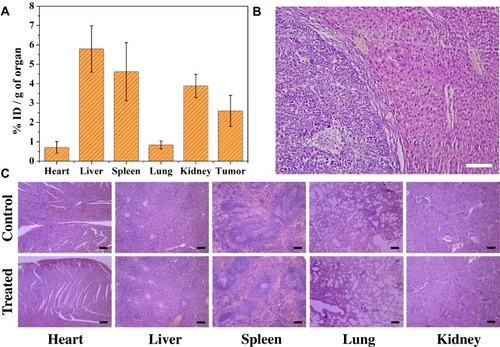
Figure 6 Biosafety of MPGds. (A) Bio-distribution of MPGds in mouse organs at 24 hrs after intravenous injection (4 mg/mL, n = 3). (B) H&E stained liver and orthotropic liver tumor tissue. (C) H&E stained tissue sections from mice 24 hrs after injection with PBS and MPGds. Scale bar: 40 μm for all images.