Figures & data
Table 1 Characterization Of Nanoparticles (n=3, Mean±SD)
Figure 1 Characterization of nanoparticles and the iRGD peptide.
Notes: (A) Nanoparticles exhibited opalescence and Tyndall effect compared to that observed for deionized water. (B) PLGA-PTX exhibited an average particle size of 147.5±9.5 nm with a narrow size distribution (PDI<0.1). (C) Nanoparticles were spherical in shape and possessed smooth surfaces as shown in the transmission electron microscopy image (scale bar = 200 nm). (D) Changes in PLGA-PTX particle size at different storage times in PBS and PVA at 4°C. (E) PLGA-PTX exhibited a sustained release in pH 6.4 and pH 7.4 PBS containing 0.1% Tween-80. (F) The disulfide bond of iRGD was determined in the absence (non-reducing) or presence (reducing) of DTT by mass spectrometry.
Abbreviations: PLGA, poly lactic-co-glycolic acid; PTX, paclitaxel; PLGA-PTX, paclitaxel-loaded PLGA; PDI, polydispersity index; PBS, phosphate buffer saline. DTT, dithiothreitol.
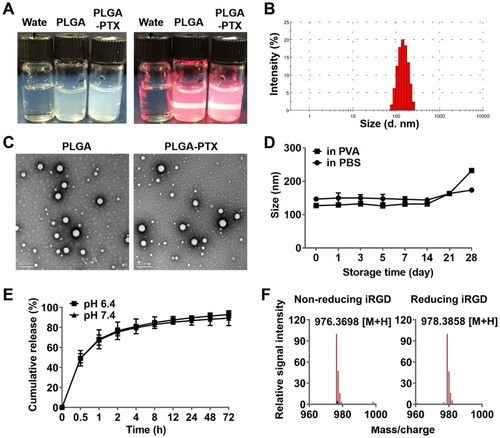
Figure 2 In vitro cytotoxicity and hemolysis assay of nanoparticles.
Notes: (A) COLO205 colorectal cancer cells were treated with PLGA-PTX over a time course, and this was followed by cell viability measurement using the CCK-8 assay. (B) COLO205 cells were treated with free PTX or encapsulated PLGA-PTX combined with or without iRGD for 72 h. (C) Cytotoxicity of PTX or PLGA-PTX against various colorectal cancer cells. (D) Hemolysis assay. DI water and NS were used as the positive (100% hemolysis) and negative control, respectively. The appearance of hemolysis (left panel) and percentage of hemolysis (right panel) were assessed for each group.
Abbreviations: PLGA, poly lactic-co-glycolic acid; PTX, paclitaxel; PLGA-PTX, paclitaxel-loaded PLGA; DI water, deionized water; NS, normal saline.
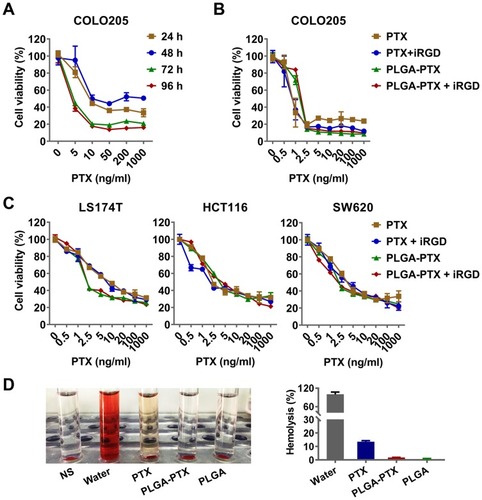
Figure 3 PLGA-PTX-induced cell cycle arrest and tumor cell apoptosis.
Notes: Colorectal cancer cells (LS174T) were treated with PLGA-PTX over a time course. (A) Cell morphology was recorded by PCM, and cell nuclei were stained via Hoechst dye, and this was followed by fluorescence microscope imaging. Cell apoptosis was assayed by flow cytometry after dual staining with FITC-labeled Annexin V and PI. Scale bar, 50 μm. (B) Caspase 3 activation was analyzed by quantification of cleaved caspase 3 relative to a reference at 0 h. (C) Flow cytometry analysis revealed PLGA-PTX treatment induced accumulation of DNA from G0/G1 phase into G2/M phase over time following PI staining. **P<0.01; ***P<0.001.
Abbreviations: PLGA, poly lactic-co-glycolic acid; PTX, paclitaxel; PLGA-PTX, paclitaxel-loaded PLGA; PCM, phase contrast microscope; FITC, fluorescein; isothiocyanate; PI, propidium iodide.
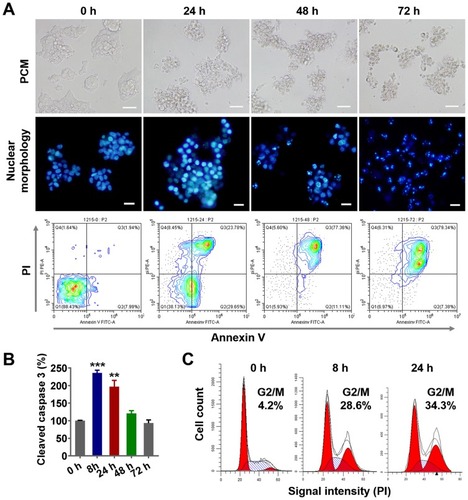
Figure 4 PLGA-PTX inhibits tumor spheroid cell migration and invasion.
Notes: Colorectal cancer cells (HCT116) were cultured in an ultra-low attachment plate to form tumor spheroids, and this was followed by treatment with low concentration of PLGA-PTX in culture medium over time. (A) The tumor cell migration away from tumor spheroids in the absence or presence of 10 ng/mL of PLGA-PTX was recorded using an inverted microscope. Scale bar, 100 μm. (B) The migration areas were measured and presented as the fold change relative to the areas at 0 h. (C) The invasion of tumor cells that disseminated from spheroids into the matrigel matrix was imaged using an inverted microscope. Scale bar, 100 μm. *P<0.05; **P<0.01; ***P<0.001.
Abbreviations: PLGA, poly lactic-co-glycolic acid; PTX, paclitaxel; PLGA-PTX, paclitaxel-loaded PLGA; PBS, phosphate buffer saline.
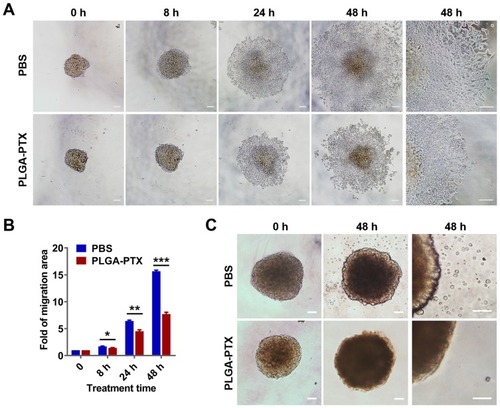
Figure 5 Tumor vasculature distribution and expression of the iRGD receptor.
Notes: LS174T tumor frozen sections were prepared for immunofluorescence staining and imaging. (A) Blood vessel distributions were stained with anti-CD31 antibody (red). (B) The expression of iRGD receptors, including integrin αv, integrin α5, and neuropilin-1, were assayed by staining with anti-receptor antibodies (red). Tumor blood vessels (green) and nuclei (blue) were co-stained with anti-CD31 antibody and DAPI. Scale bar, 100 µm.
Abbreviations: CD31, cluster of differentiation 31; DAPI, 4,6-diamidino-2-phenylindole.
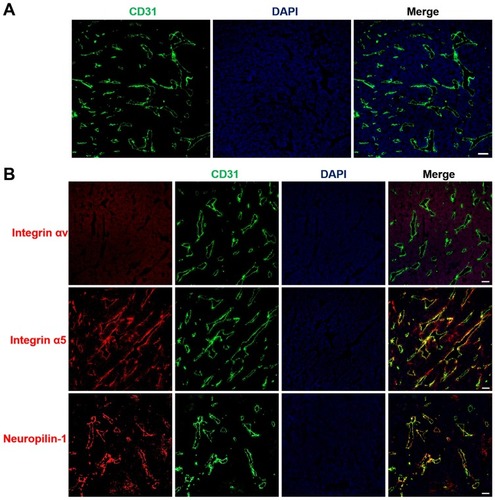
Figure 6 Distribution of nanoparticles in tumor-bearing mice and tumor xenografts.
Notes: Mice bearing LS174T tumors (150–200 mmCitation3) were given a single intravenous injection of PLGA-DID alone or combined with iRGD. (A) Mice were imaged using the SPECTRAL Lago NIR imaging system over time. The tumor location was marked with red circles. (B) At 24 h post injection, mice were sacrificed, and tumors and major organs were harvested for ex vivo imaging. Fluorescence intensity in tumors and organs was quantified. n=3. (C) LS174T tumors were sectioned after the injection of mice with PLGA-COU alone or in combination with iRGD. The distribution of PLGA-COU (green) within tumors was imaged under a confocal microscope. Tumor vessels were labeled with anti-CD31 antibody (red), and nuclei were visualized with DAPI (blue). Scale bar, 100 µm. ***P<0.001.
Abbreviations: PLGA, poly lactic-co-glycolic acid; DID, 1,1ʹ-dioctadecyl-3,3,3ʹ,3ʹ- tetramethylindodicarbocyanine; COU, coumarin-6; CD31, cluster of differentiation 31; DAPI, 4,6-diamidino-2-phenylindole.
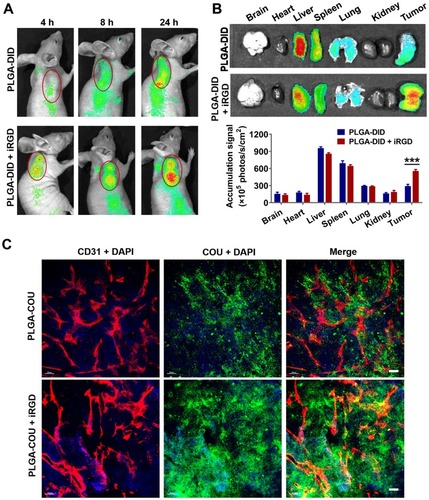
Figure 7 In vivo antitumor efficacy evaluation.
Notes: (A) At the onset of a palpable tumor (about 50 mmCitation3), BALB/c nude mice bearing LS174T tumors were intravenously injected with free PTX, PTX + iRGD, PLGA-PTX, PLGA-PTX + iRGD, or NS every 2 days for a total of three injections (PTX and iRGD at dose of 10 mg/kg). Tumor volume was calculated as length×widthCitation2×0.5. The mean tumor volume of each group and the tumor volume of each mouse in each group were presented over time. (B) Tumors obtained from the sacrificed mice were imaged, and tumor weight was measured for each group. *P<0.05; **P<0.01.
Abbreviations: PLGA, poly lactic-co-glycolic acid; PTX, paclitaxel; PLGA-PTX, paclitaxel-loaded PLGA; NS, normal saline.
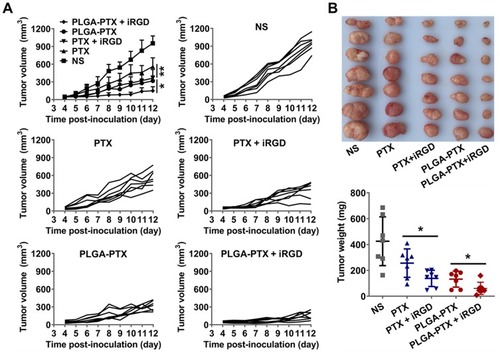
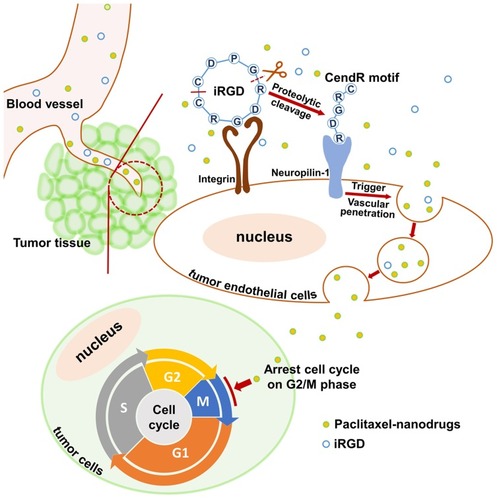
Figure 8 Schematic diagram of co-administration of iRGD with nanodrugs.
Notes: When the co-administered nanodrugs and iRGD peptide reach the tumor tissue, iRGD binds to the integrin receptor and is proteolytically cleaved. The exposed tissue-penetrating motif CendR interacts with the neuropilin-1 receptor and triggers nanodrug penetration into tumor tissues. Ultimately, paclitaxel nanodrugs induce tumor cell cycle arrest and sequential apoptosis.