Figures & data
Table 1 Zeta Potential Characterization of Magnetosome and PEG-Fe3O4
Figure 1 Characterization of magnetosome and PEG-Fe3O4. (A) TEM images of typical magnetosome and PEG-Fe3O4 particles. Scale bars, 200 nm. (B) SDS-PAGE image of plasma corona proteins on particles.
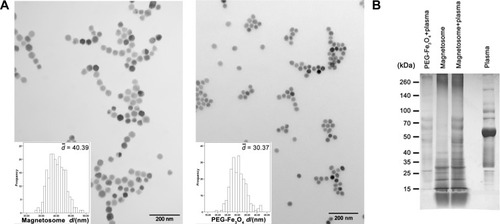
Table 2 Top 20 Most Abundant Plasma Proteins Adsorbed on Magnetosomes and PEG-Fe3O4 Identified by LC-MS/MS
Figure 2 Overview of identified corona proteins postprocessing.
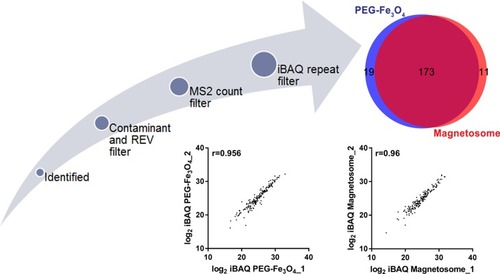
Figure 3 Protein plasma concentrations as well as iBAQ intensities of corona proteins identified by LC-MS/MS. Identified magnetosome corona proteins (A) and the most 20 abundant corona proteins (B) iBAQ intensities and relative concentrations in plasma. (C) Plasma protein concentrations from Plasma Proteome Database (PPD).Citation36 Y-axis represents different proteins and x-axis is different concentrations observed for each protein. As in PPD, one protein usually has several concentrations. Intensities in log 2 scales are indicated by different colors. (D) Overlaps of proteins identifications from magnetosome or PEG-Fe3O4 incubated with plasma by LC-MS/MS. Venn plot shows the most 20 abundant corona proteins and top 20 abundant plasma proteins. (E) Comparison of the top 20 abundant proteins (in gene names) relative abundance in the magnetosome and PEG-Fe3O4 corona.
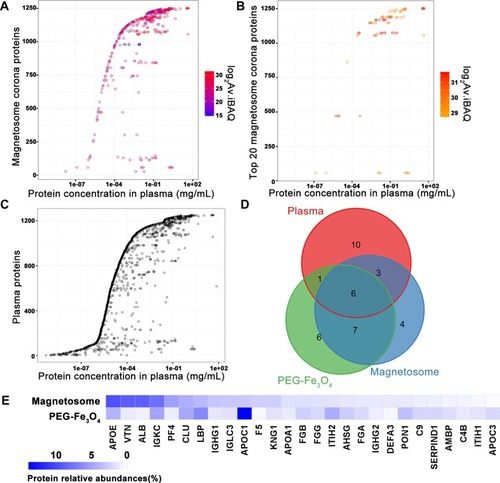
Figure 4 Characterization of the top 20 abundant plasma proteins identified on magnetosomes by LC-MS/MS. Classifications according to their isoelectric point (pI) (A), molecular weight (MW) (B) or GRAVY values (C). Amino acid compositions are shown in (D). (E) CD spectra of top three magnetosome corona proteins alone (0.02 mg/mL, black line) or in the presence of magnetosome (MAG) or PEG-Fe3O4 (Fe3O4) with different concentrations (0.02, 0.01 and 0.0033 mg/mL Fe concentration, represented by yellow, blue and green dashed lines, respectively). Spectra are shown in mean residue molar ellipticity (Mol.Ellip.). Black dashed lines correspond to spectral peaks at 208 and 222 nm (principle α-helix peak).
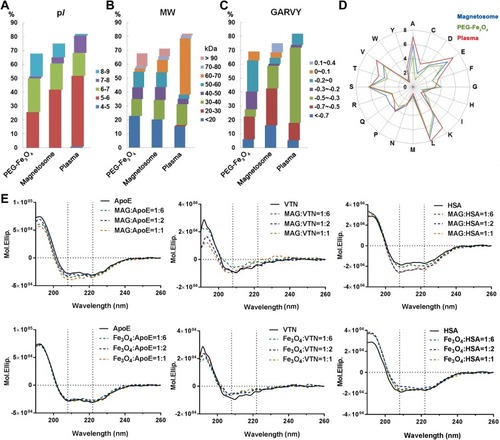
Figure 5 Bioinformatics analysis of magnetosome-corona protein. (A) GO molecular function enrichment of the top 20 abundant proteins. (p < 0.05) Each protein was represented by a certain gene name; surrounding color shows the relative abundance. Details are given in Table S4. (B) Corona protein-interaction network. Interacted receptors with membrane location were obtained from BioGRID, IMEx, IntAct, MINT and UniProt databases. Abundant corona proteins are colored by their relative abundance.
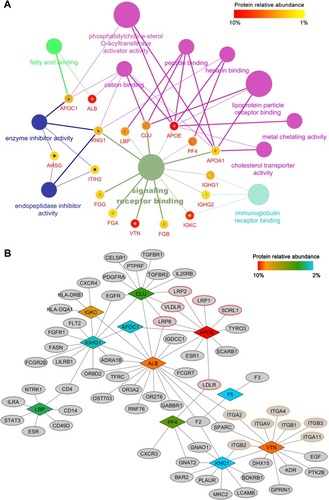
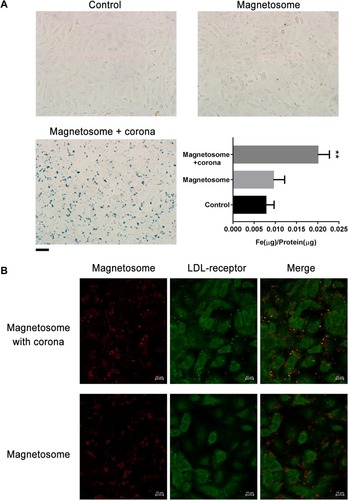
Figure 6 Internalization of magnetosome-corona complexes by EC cells. (A) Enhancement of magnetosome cell uptake in the presence of protein corona. Prussian blue staining and intracellular iron concentrations of EC cells (control) incubated with magnetosomes (10 μg/mL Fe concentration) with or without corona for 3 h. Scale bars 20 μm. **p<0.01 (B) Confocal images of EC cells treated with magnetosomes (20 μg/mL Fe concentration) with or without corona for 5 h. Large colocalization of LDL receptors (green) and magnetosomes (red) signals were found in the presence of corona. Scale bars 10 μm.