Figures & data
Figure 1 Synthesis of star polymers. (A–C) Size exclusion chromatographs of star polymers. (A) POEGA stars with unreactive peripheral moieties (“BSPA”) (blue) and POEGA-BSPA arms (red). (B) POEGA stars with thiol reactive moieties (“PDS”) (blue) and POEGA-PDSD arms (red). (C) POEGA/PDEGA (50/50) stars with thiol reactive groups on the PDEGA arms (“DEG”), POEGA-BSPA arms (red) and PDEGA-PDSD arms (green). (D) Schematic of the star polymers.
Abbreviations: Star-OEGA-Bz, Star polymers incorporating a POEGA corona with BSPA; POEGA, Poly oligo (ethylene glycol) methyl ether acrylate.
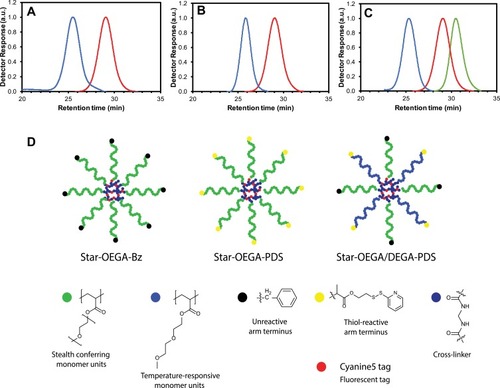
Figure 2 Impact of star polymers on cell viability. (A) Jurkat and Nalm-6 cells (B) HUVEC cells were exposed to the star polymers for 24 hrs and 48 hrs, respectively. The cell viability was measured using the resazurin assay.
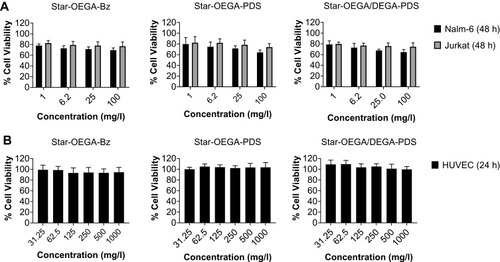
Figure 3 Thiol-reactive star polymers display enhanced association with patient derived xenografts (PDXs). (A) PDXs were generated from mononuclear cells from pediatric ALL biopsies (B- and T-ALL) inoculated in immunodeficient mice. Three PDX samples from each subtype harvested from spleens, and one matched sample from bone marrow, were exposed to the star polymers for 30 mins. (B) Cellular association was determined by flow cytometry and represented by a median fluorescence intensity (MFI) normalized against control Star-OEGA-Bz. * p < 0.05, ** p < 0.01. *** p < 0.001.
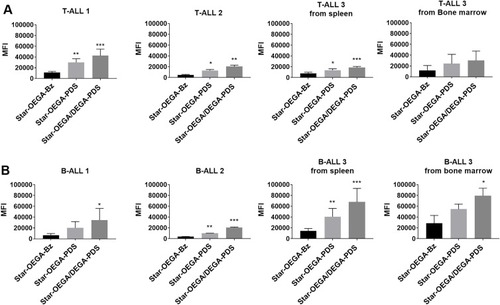
Figure 4 Thiol-reactive star polymers display enhanced association with Jurkat and Nalm-6 cell lines. The cells were incubated with the star polymers at 10 mg/l for up to 30 mins at 37°C. (A) Star-OEGA/DEGA-PDS exhibited the highest association and as early as 5 mins followed by (B) Star-OEGA-PDS and (C) Star-OEGA-Bz. The B-ALL cell line (Nalm-6) exhibited higher association with the thiol-reactive star polymers compared to Jurkat (T-ALL) cell line. For Star-OEGA-Bz with unreactive groups at the periphery the association was similar in both cell lines. All experiments were performed in triplicate.
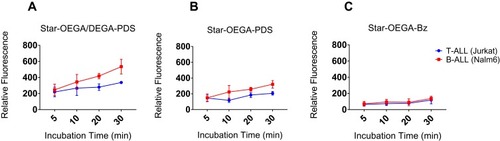
Figure 5 Correlative light and electron microscopy (CLEM) reveals the endosomal accumulation of star polymers. Nalm-6 cells were transfected with the early endosomal marker 2*FYVE-GFP and treated with the star polymers for 20 mins. Left panels: Nalm-6 cells imaged by confocal microscopy and (i–iii) corresponding electron micrographs of the same cell. White box denotes correlated early endosomes from the confocal Z-stack and visualized in further detail at (i) low-magnification and (ii) high-magnification. Red box highlights the correlated nanoparticles-positive endosomes (iii). (A) Control untreated Nalm-6 cell denote early endosomes highlighted in green without treatment of star polymers. (B) cells treated with Star-OEGA-Bz demonstrated abundant early endosomes and rapid accumulation of Star-OEGA-Bz within a distinct population of endomembranes identified as late endosome/lysosome by high-resolution morphometric analysis. (C) Star-OEGA-PDS rapidly accumulated within late endosomes/lysosomes. (D) Star-OEGA/DEGA-PDS stars trafficked in early endosomes after 20 mins uptake.
Abbreviations: Nuc, nucleus; EE, early endosomes; PM, plasma membrane; M, mitochondria; LE, late endosome/lysosome.
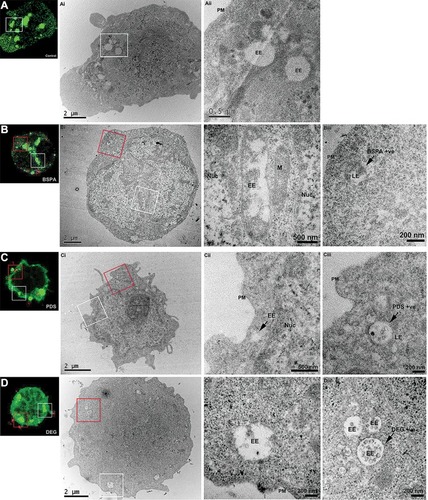
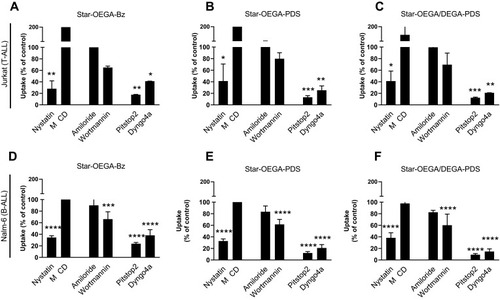
Figure 6 Endocytosis pathway of star polymers. Jurkat and Nalm-6 and cells were treated with endocytosis inhibitors before exposure to the star polymers (10 mg/l for 30 mins) and analysis by flow cytometry. (A–C) In Jurkat cell lines endocytosis was blocked by cellular treatment with, Nystatin, Pitstop2, and Dyngo4a. (D–F) In Nalm-6 cell lines endocytosis was blocked by cellular treatment with Nystatin, Pitstop2, Dyngo4a, and Wortmannin. Data represent the percentage of nanoparticles uptake in cells treated with endocytosis inhibitors to that of the control group without treatment. * p < 0.05, ** p < 0.01. *** p < 0.001 **** p < 0.0001. Methyl-β-cyclodextrin (MβCD).