
Figures & data
Table 1 Binding energy (Kcal.mol−1) in the four nanodrugs complexes at the optimized stable condition
Figure 1 The results of molecular modeling and docking calculations for the four different nanodrugs.
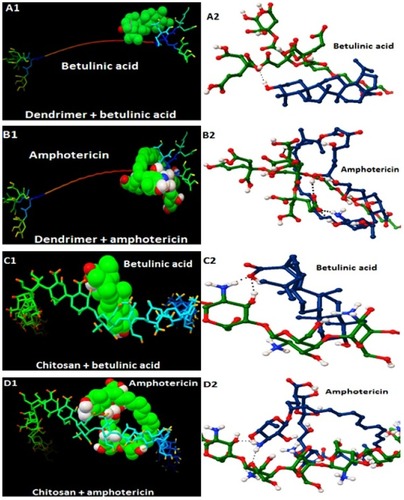
Table 2 The results of size, size distribution (PDI) and zeta potential of different nanoparticles
Figure 2 The mean cumulative release of Amp and BA from the four nanodrugs of AK, BK, AD and BD after 48 h (slow release).
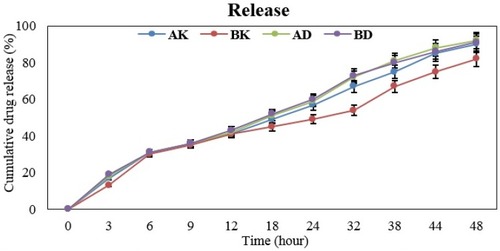
Figure 3 The flow cytometry results related to cellular uptake of nanodrug AK (nano amphotericin chitosan) =98.6%, BK=98%, AD=64% and BD=94.6. Also, the cellular uptake of A was 30% and B was equal to 28%.
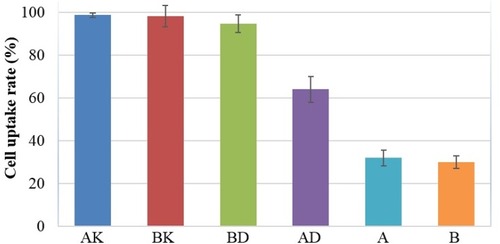
Figure 4 The viability effects of the nanodrugs AK, BK, AD and BD at the same concentration of 20 µg/mL along with K(Chitosan) and D(dendrimer) at the concentration of 10 µg/mL compared to control group on the Balb/c mouse-derived peritoneal macrophages after 48 h incubation. The values are expressed as Mean ± SD from three independent experiments with P˂0.001.
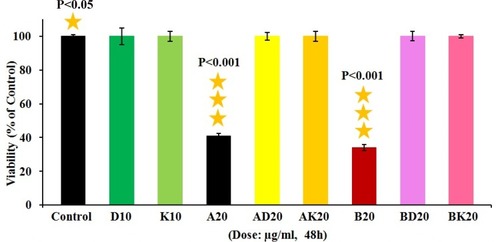
Figure 5 The killing effects of nanodrugs BK(nano amphotericin chitosan)20 µg/mL (with the killing effects of 88%), AK20 µg/mL, AD20 µg/mL, BD20 µg/mL, nano K(Chitosan)10 µg/mL, A20 µg/mL and B20 µg/mL on the viability of L. major promastigotes after 48 h incubation. The values are expressed as Mean ± SD from three independent experiments with P˂0.001.
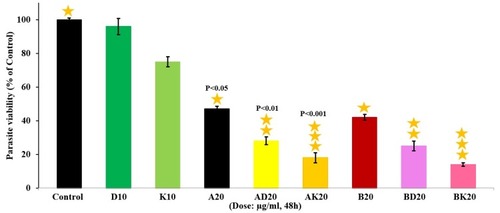
Figure 6 The therapeutic effects of nanodrugs AK(nano amphotericin chitosan)20 µg/mL, AD20 µg/mL, BK20 µg/mL and BD20 µg/mL on the L. major-infected macrophages after 48 h incubation. The highest killing effects were related to BK20 µg/mL with the killing effects of 81%. The values are expressed as Mean ± SD from three independent experiments with P˂0.001.
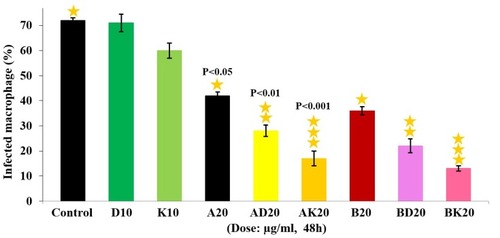
Figure 7 The lesion size in L. major-infected mice received various formulations including K12.5, D35.5, AD50, B(20 and 40), GUL200, AK10, BD40, A (10 and 50) and BK20 mg/kg. As the figure shows, the lesion size reached to zero in nanodrugs of AK10 mg/kg and BK20 mg/kg receivers (P˂0.001).
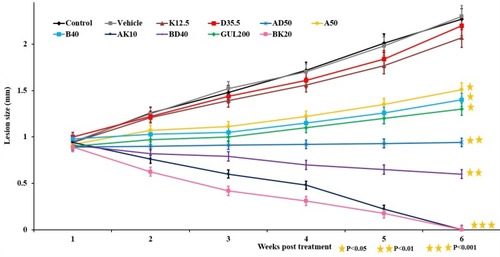
Figure 8 The evaluation results of parasite burden in mice groups of BK20, AK10, BD40, AD50, A(10 and 50), B(20 and 40), GUL200, K12.5, D35.5 mg/kg and control group. As the results showed the lowest parasite burden was related to BK20=5.57×10⁶±0.2 and AK10 mg/kg=8.22×106±0.3 groups. The results are expressed as Mean ± SD from three independent experiments.
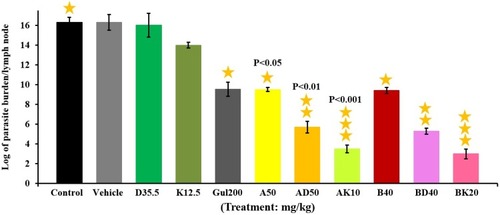
Figure 9 The standard curve obtained from the amplification of L. major SODB1 gene over 5-fold serial dilutions of the parasitic DNA, ranging from 5.3×10⁴ parasites to 5.3 parasites per reaction.
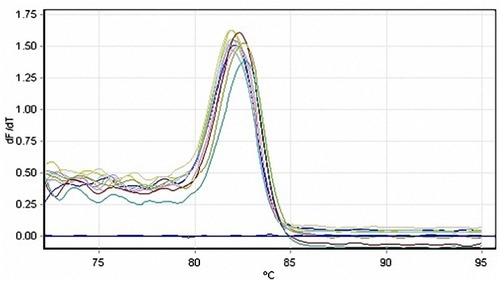
Table 3 Calculation of the parasite number of popliteal lymph nodes in different groups of L. major infected BALB/C mice at 8 weeks post infection using real-time PCR and LDA
Table 4(A) Synthesis and characterization of various types of chitosan-based nanoparticles in vitro and in vivo environments, reported in different studies
Table 4(B) Synthesis and characterization of various types of dendrimer nanoparticles in vitro and in vivo environments, reported in different studies