
Figures & data
Table 1 Composition of various experimental nanoparticle formulations with their physicochemical characteristics
Figure 1 AFM and TEM images of experimental nanoparticles.
Notes: AFM (A) DOX-NP, (B) DOX-Ab-NP and TEM (C) DOX-NP and (D) DOX-Ab-NP.
Abbreviations: PLGA, polylactic-co-glycolic acid; PVA, poly (vinyl alcohol); AFM, Atomic force microscopy; DOX, doxorubicin; Ab, antibody; NP, nanoparticle; TEM, transmission electron microscopy.
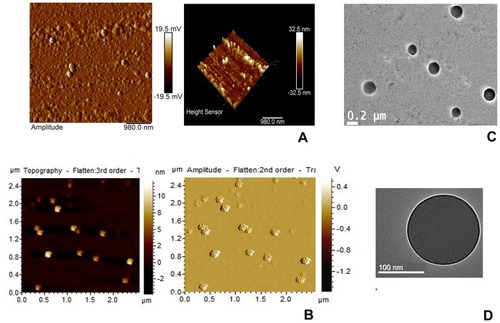
Table 2 Weight % and atomic % of elements in various nanoparticles
Figure 2 In-vitro drug release profile of DOX from DOX-NP in different buffers (citrate buffer (pH 3), acetate buffer (pH 5), phosphate buffer (pH 7.4), and bicarbonate buffer (pH 10)) and different media (PBS release media added with hydroxy propyl β-cyclodextrin (HBC)/TWEEN, tween 80). Data show mean±SD (n=3).
Abbreviations: PVA, poly (vinyl alcohol); TPGS, tocopherol polyethylene glycol succinate; DOX, doxorubicin; Ab, antibody; NP, nanoparticle.
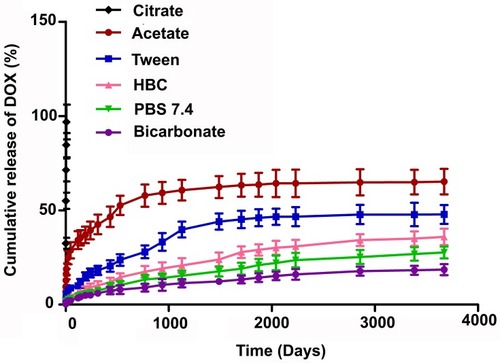
Table 3 In-vitro drug release kinetic data tested on various release kinetic models with corresponding R2 values and release exponent (n) (Korsmeyer–Peppas model)
Figure 3 Different studies for confirmation of antibody conjugation on the surface of polylactic-co-glycolic acid (PLGA) nanoparticles.
Notes: (A) Flow cytometry data for unconjugated nanoparticles, (B) for antibody-conjugated nanoparticles, (C) laser-scanning confocal microscopy, showing FITC labeled CD-340 antibody-conjugated scattered nanoparticles and (D) SDS-PAGE gel electrophoresis, showing CD-340 antibody-conjugated NP, antibody unconjugated NP and free-antibody.
Abbreviations: DOX, doxorubicin; Ab, antibody; NP, nanoparticle.
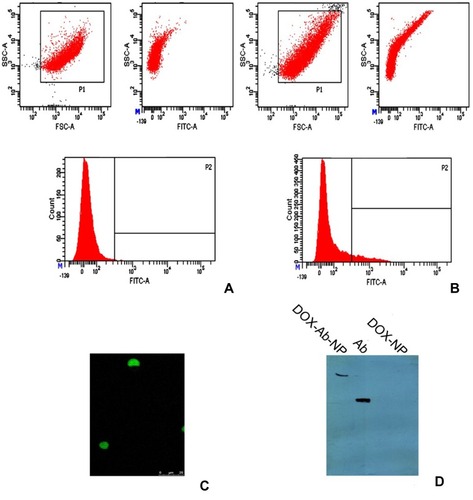
Figure 4 In-vitro cytotoxicity data of DOX, DOX-NP, and DOX-Ab-NP determined in SKBR-3 cells, MCF-7 cells, and MDA-MB-231 cells. Data show mean ±SD (n=3).
Abbreviations: DOX, doxorubicin; Ab, antibody; NP, nanoparticle.
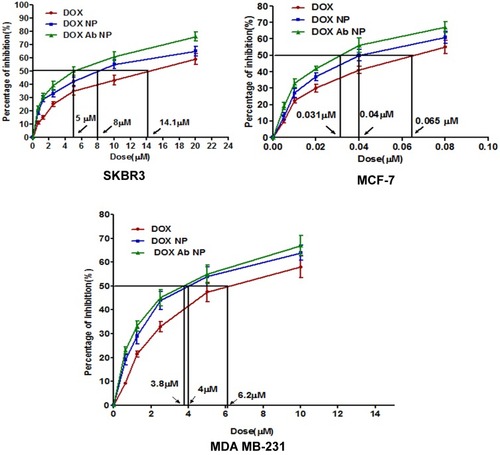
Figure 5 Cellular uptake of antibody conjugated and unconjugated nanoparticles in various cell lines.
Notes: (A) Cellular uptake of DOX-NP and DOX-Ab-NP in SKBR-3, MCF-7, and MDA-MB-231 cells observed by confocal microscopy at 1 and 6 hrs, respectively (B) Cellular uptake of antibody-conjugated blank nanoparticles in SKBR-3, MCF-7, and MDA-MB-231 cells observed by confocal microscopy at 6 hrs.
Abbreviations: DOX, doxorubicin; Ab, antibody; NP, nanoparticle.
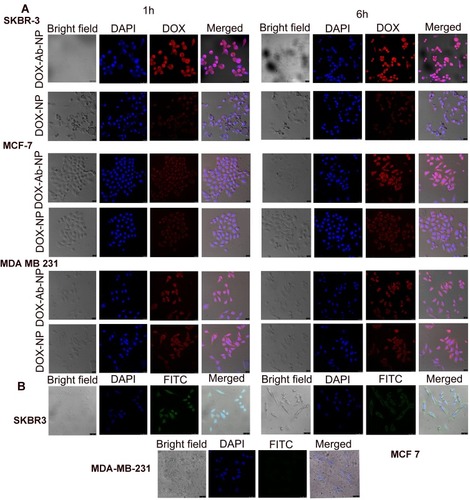
Figure 6 Apoptosis and cell cycle analysis data of breast cancer cells treated with experimental formulations and free-drug.
Notes: (A) Apoptosis study by flow cytometry of SKBR-3 cells with the treatment of free DOX, DOX –NP, and DOX-Ab-NP after 24 hrs. Cell cycle analysis by flow cytometry for (B) SKBR-3 cells and (C) MCF-7 cells treated with DOX, DOX-NP, and DOX-Ab-NP for 24 hrs.
Abbreviations: DOX, doxorubicin; Ab, antibody; NP, nanoparticle.
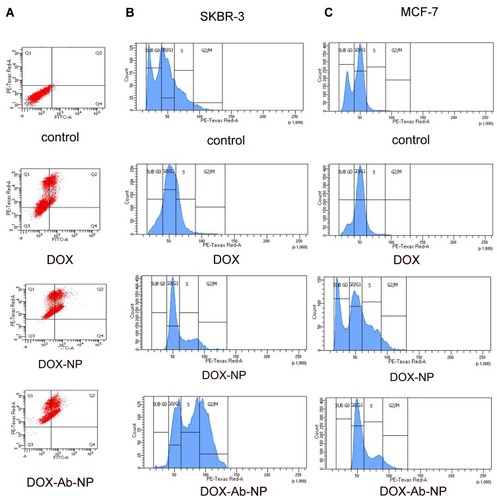
Figure 7 Comparative HER2 levels, caspase activity, and PARP cleavages in SKBR-3 cells, MCF-7 cells, and MDA-MB-231 cells.
Notes: (A) Determination of the relative level of HER2 in SKBR-3 cells, MCF-7 cells, and MDA-MB-231 cells. (B) Activation of Caspase in MDA-MB-231 cells, MCF-7 cells, and SKBR-3 cells. (C) Detection of PARP cleavage in MDA-MB-231 cells, MCF-7 cells, and SKBR-3 cells. The values of p show statistical level of significance, **p<0.05, ***p<0.01, comparison between the groups are shown by over-head lines.
Abbreviations: DOX, doxorubicin; Ab, antibody; NP, nanoparticle.
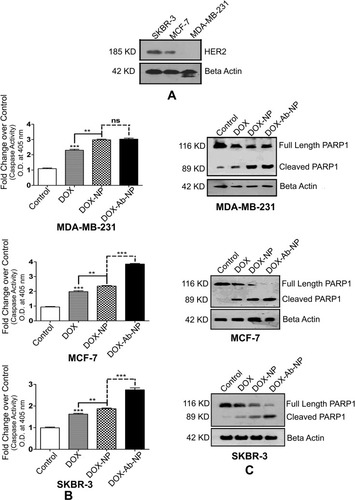
Table 4 Plasma pharmacokinetic parameters of free doxorubicin and doxorubicin released from DOX-NP and DOX-Ab-NP after intravenous bolus administration of DOX, DOX-NP, and DOX-Ab-NP with an equivalent amount of drug in BALB/c mice
Figure 8 Plasma drug concentration upon IV bolus injection (at a dose of 10 mg/kg body weight) of DOX, DOX-NP, and DOX-Ab-NP. The same curve (time point 12–96 hrs) has been shown in the magnified version in the inset. Data show mean± SD (n=3).
Abbreviations: DOX, doxorubicin; Ab, antibody; NP, nanoparticle.
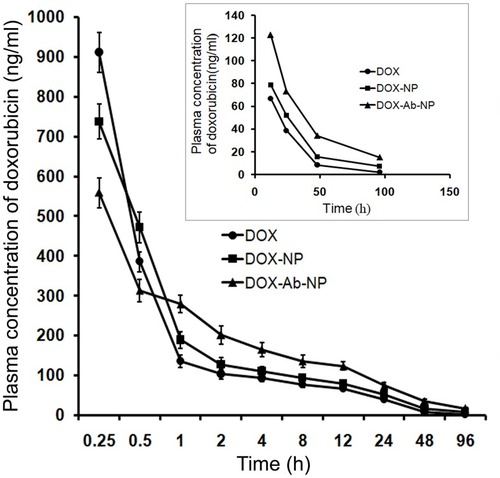
Table 5 Doxorubicin-induced cardiotoxicity parameters of different formulations after 2 weeks of final dosing
Figure 9 Comparative cardiotoxicity profiles by the treatment of DOX, BL-NP, DOX-NP, and DOX-Ab-NP.
Notes: (A) Echocardiography images. (B) Histopathology of cardiac tissue (Vascularization due to free-drug treatment was shown by the green arrow in the respective image).
Abbreviations: DOX, doxorubicin; Ab, antibody; NP, nanoparticle.
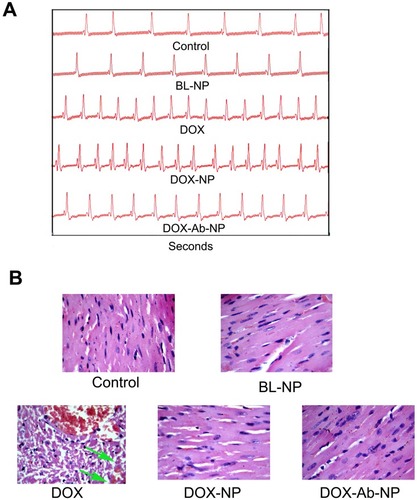
Figure 10 Biodistribution of drug/formulation data and, tumor and tumor-related data in experimental animals.
Notes: (A) Biodistribution and accumulation data of 99mTc labeled drug/formulations in experimental mice (a) time-dependent biodistribution and accumulation of 99mTc-DOX at 0.5 hrs (d) and at 4 hrs, (b) 99mTc -DOX-NP at 0.5 hrs (e) and 4 hrs, and (c) 99mTc -DOX-Ab-NP at 0.5 hrs and (f) 4 hrs, in xenograft mice-bearing breast tumor. (B) Changes in tumor volume, animal body weight, and excised tumors from the experimental mice along with the tumor growth-related representative visual image data. (a) Relative changes in tumor volume with time. Data showed mean tumor volume (mean ± SD, n=3) in different experimental and control mice. The value p<0.05 shows the level of statistical significance. Prefix of p (i.e., a–j), indicates as mentioned below: “a” indicates statistical level of significance when data were compared against normal saline treated (control) mice on day 10; “b” indicates statistical level of significance when data were compared against DOX-treated mice on day 10; “c” indicates statistical level of significance when data were compared against normal saline treated (control) mice on day 15; “d” indicates statistical level of significance when data were compared against DOX-treated mice on day 15; “e” indicates statistical level of significance when data were compared against normal saline treated (control) mice on day 20; “f” indicates statistical level of significance when data were compared against DOX-treated mice on day 20; “g” indicates statistical level of significance when data were compared against DOX-NP-treated mice on day 20; “h” indicates statistical level of significance when data were compared against normal saline treated (control) mice on day 25; “i” indicates statistical level of significance when data were compared against DOX-treated mice on day 25; “j” indicates statistical level of significance when data were compared against DOX-NP-treated mice on day 25. (b) Change of body weight of nude mice-bearing tumor. Data represent mean ± SD (n=3); data showed that there was no statistically significant variation between the groups of mice. (c) Tumors excised from the experimental mice after treatment with saline/DOX/DOX-NP/DOX-Ab-NP. (d) Images on day 25 of nude mice bearing SKBR-3 tumor after treatment with saline/DOX/DOX-NP/DOX-Ab-NP. Tumor areas have been marked with red circles in the figure.
Abbreviations: 99mTc-DOX: radiolabeled free-doxorubicin, 99mTc-DOX -NP: radiolabeled doxorubicin loaded nanoparticles, 99mTc-DOX-Ab-NP: radiolabeled doxorubicin loaded antibody conjugated nanoparticles; DOX, doxorubicin; Ab, antibody; NP, nanoparticle.
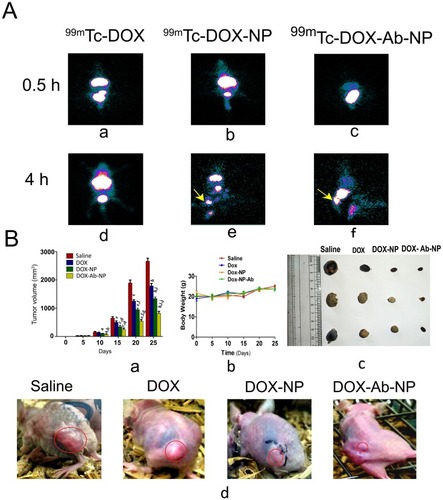
Table 6 Biodistribution data of 99mTc-DOX, 99mTc-DOX-NP, 99mTc-DOX-Ab-NP in mice after IV. administration