Figures & data
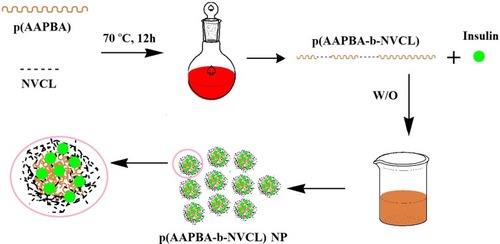
Scheme 1 Schematic representation of temperature- and glucose-sensitive poly (3-acrylamidophenylboronic acid-block-N-vinylcaprolactam) p(AAPBA-b-NVCL) nanoparticles.
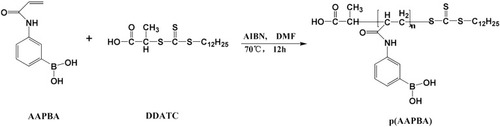
Scheme 2 Synthesis of p(AAPBA).
Scheme 3 Synthesis of p(AAPBA-b-NVCL).
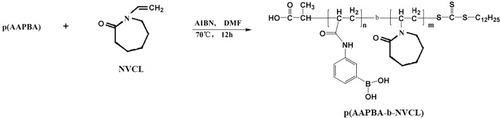
Table 1 LCST, The Molecular Weights (Mw And Mn), Molecular Weight Distributions And Size Distribution Of Self-Assembled Nanomicelles With Different Ratios
Figure 1 FT-IR spectra of NVCL, AAPBA, pAAPBA, and p(AAPBA-b-NVCL)3.
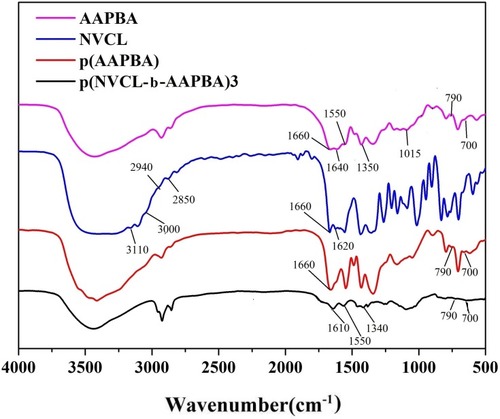
Figure 2 1H-NMR spectra of (A) NVCL, (B) AAPBA, (C) pAAPBA, and (D) p(AAPBA-b-NVCL)3.
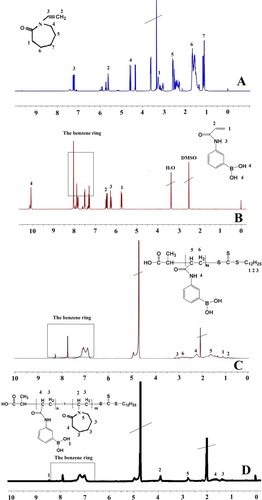
Table 2 The LCST And Zeta Potential Of p(AAPBA-b-NVCL) Nanoparticles With Different Ratios
Figure 3 Hydrodynamic diameters at different: (A) pH, (B) temperatures, (C) glucose concentration, and (D) reversible glucose sensitivity.
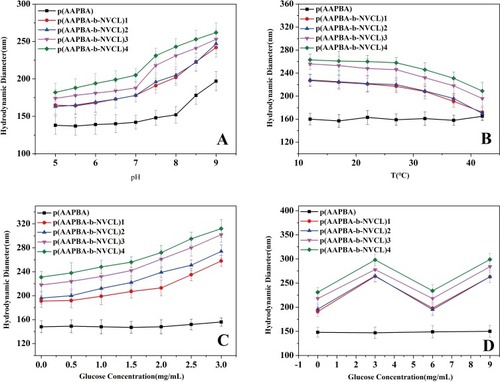
Figure 4 TEM of p(AAPBA-b-NVCL)3 nanoparticles (A) before and (B) after treatment with 3 mg/mL glucose.
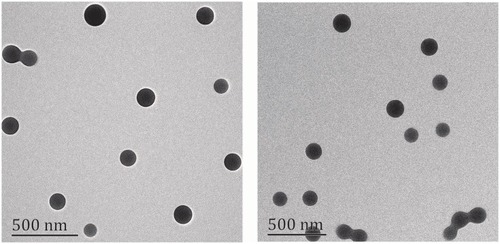
Table 3 Insulin Loading Capacity And Encapsulation Efficiency Of p(AAPBA-B-NVCL) Nanoparticles
Figure 5 In vitro cumulative release of insulin at pH 7.4 in PBS from (A) was p(AAPBA), p(AAPBA-b-NVCL)1, p(AAPBA-b-NVCL)2, p(AAPBA-b-NVCL)3, and p(AAPBA-b-NVCL)4 at 0 mg/mL glucose concentration; (B) was p(AAPBA), p(AAPBA-b-NVCL)1, p(AAPBA-b-NVCL)2, p(AAPBA-b-NVCL)3, and p(AAPBA-b-NVCL)4 at 1 mg/mL glucose concentration; (C) was p(AAPBA), p(AAPBA-b-NVCL)1, p(AAPBA-b-NVCL)2, p(AAPBA-b-NVCL)3, and p(AAPBA-b-NVCL)4 at 3 mg/mL glucose concentration; and (D) was p(AAPBA-b-NVCL)3 nanoparticles at 0, 1, and 3 mg/mL glucose concentrations.
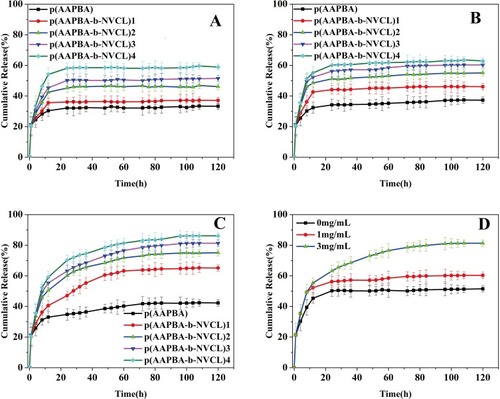
Figure 6 Cell viability of p(AAPBA-b-NVCL) nanoparticles by MTT assay at 37°C after incubation for 24 hrs. All values are presented as mean±SD (n = 5).
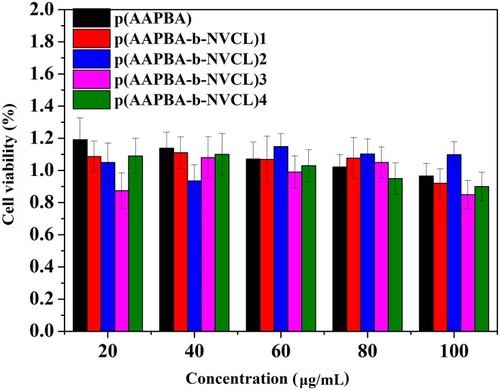
Figure 7 Representative images of HE staining results from (A) heart, (B) liver, (C) spleen, (D) lung, and (E) kidney with 1) control group (0mg); 2) p(AAPBA-b-NVCL)1 group (10mg); 3) p(AAPBA-b-NVCL)2 group (10mg); 4) p(AAPBA-b-NVCL)3 group (10mg); and 5) p(AAPBA-b-NVCL)4 group (10mg).
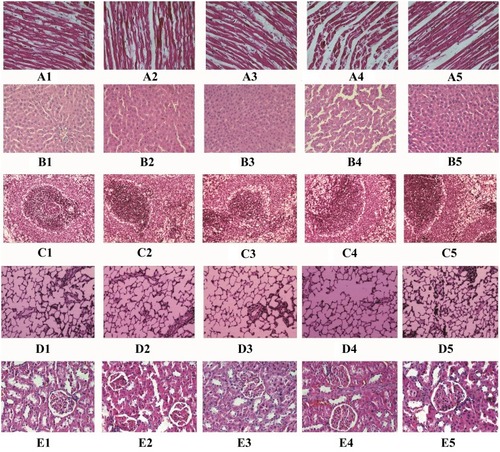
Table 4 Effect Of Administration By Injection Of Nanoparticles On The Biochemical Parameters Of Rats After 10 d (n=5, mean±SD)
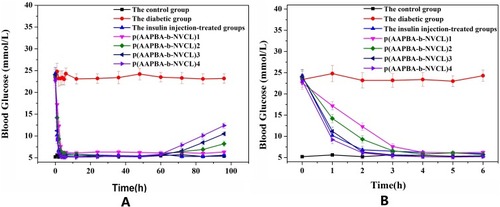
Figure 8 Blood glucose concentration after injection (A over 96 hrs, B over 6 hrs, because A did not show hypoglycemic effect within the first 6 hrs, and so we placed it separately, that is as B).