Figures & data
Figure 1 TiO2 nanonodules in a tailored size of 300 nm created within micropit architecture of titanium surfaces. (A) The strategic design of micro-nano-hybrid topography of TiO2 is described schematically. Addition of 300 nm nanonodules to the acid-etching-created micropit surface was planned. (B) Scanning electron micrography (SEM) before and after TiO2 sputter deposition onto the acid-etched (micropit) surface. Note that the nanonodular development of TiO2 at the flank (arrowheads) and top of existing peaks, while preserving the peak lines of the microscale compartments, manifesting the hybrid configuration of micro- and nano-architecture as a result. (C) Quantitative measurement of surface roughness and surface area of the micropit surface with and without 300 nm nanonodules (n = 9). The surface area was measured in a 5 μm × 5 μm horizontal plane.
Notes: aP < 0.05; bP < 0.01, indicating a statistically significant difference between the surfaces with micropits alone and with micropits and nanonodules.

Figure 2 Age-dependent changes in hydrophilicity of micropit and micro-nano-hybrid titanium surfaces after UV treatment. Fresh (immediately after UV treatment) and aged (3 and 7 days after UV treatment) UV-treated titanium surfaces as well as UV-untreated titanium surfaces are compared. Upper panels show the top and side views of titanium discs immediately after a 10 μL droplet of distilled H2O was placed. Lower panels show the calculated area of spread and the contact angle of H2O.
Note: Data are mean ± SD (n = 3).
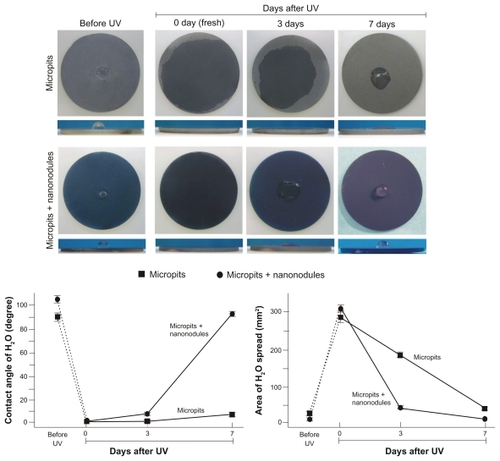
Figure 3 Age-dependent change of osteoblast attachment to UV-treated micropit and micro-nano-hybrid titanium surfaces. UV-treated titanium disks of different ages – fresh (immediately after UV treatment), 3-day-old (stored for 3 days in the dark after UV treatment) 0, and 7-day-old surfaces – were tested. Titanium disks before UV treatment are also compared. The number of rat bone marrow–derived osteoblasts attached to titanium surfaces after incubation for 3 hours ([A] early stage attachment) and 24 hours ([B] late-stage attachment), as evaluated by WST-1 colorimetry.
Notes: Data are mean ± SD (n = 3); aP < 0.05; bP < 0.01, indicating a statistically significant effect of age of titanium.
![Figure 3 Age-dependent change of osteoblast attachment to UV-treated micropit and micro-nano-hybrid titanium surfaces. UV-treated titanium disks of different ages – fresh (immediately after UV treatment), 3-day-old (stored for 3 days in the dark after UV treatment) 0, and 7-day-old surfaces – were tested. Titanium disks before UV treatment are also compared. The number of rat bone marrow–derived osteoblasts attached to titanium surfaces after incubation for 3 hours ([A] early stage attachment) and 24 hours ([B] late-stage attachment), as evaluated by WST-1 colorimetry.Notes: Data are mean ± SD (n = 3); aP < 0.05; bP < 0.01, indicating a statistically significant effect of age of titanium.](/cms/asset/4211525e-a1e2-4dcd-b223-0dfad072d987/dijn_a_22099_f0003_b.jpg)
Figure 4 Age-dependent change of osteoblast affinity of UV-treated titanium surfaces evaluated by the initial spread and cytoskeletal arrangement of osteoblasts. Osteoblasts were seeded onto UV-treated micropit and micro-nano-hybrid surfaces of different ages – fresh (immediately after UV treatment) and 7-day-old surfaces. Representative confocal microscopic images of cells stained with rhodamine phalloidin for actin filaments (red) and antivinculin (green) 6 hours after seeding are presented. Low (A) and high (B) magnification images, along with cytomorphometric evaluations (C), are presented.
Notes: Data are mean ± SD for panel C (n = 10); aP < 0.05; bP < 0.01, indicating a statistically significant effect of age of titanium.
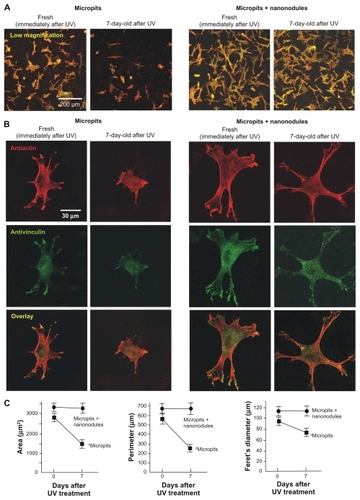
Figure 5 Osteoblast proliferation on differently aged UV-treated titanium surfaces. Osteoblasts were cultured on UV-treated micropit and micro-nano-hybrid titanium disks with different ages – fresh, 3-day-old, and 7-day-old surfaces. (A) Cell density at day 3 of culture. (B) Cell proliferative activity evaluated by BrdU incorporation per cell at day 3 of culture.
Notes: Data are mean ± SD (n = 3) for all panels; aP < 0.01, indicating a statistically significant effect of age of titanium.
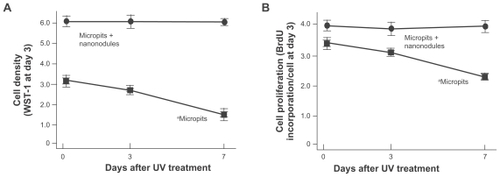
Figure 6 Osteoblast functions on differently aged UV-treated titanium surfaces. Osteoblasts were cultured on UV-treated micropit and micro-nano-hybrid titanium disks with different ages – fresh, 3-day-old, and 7-day-old surfaces. (A) Alkaline phosphatase activity at day 7. (B) Calcium deposition at day 14 of culture.
Notes: Data are mean ± SD (n = 3) for all panels; aP < 0.05; bP < 0.01, indicating a statistically significant effect of age of titanium.
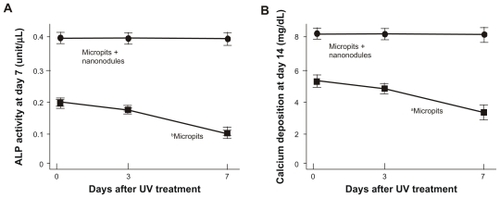
Figure 7 Experimental results addressing the mechanism underlying the sustained high bioactivity of UV-treated micro-nano-hybrid titanium surfaces. Osteoblast attachment after 3 hours (early stage attachment [A] and 24 hours late-stage attachment, [B] incubation plotted against the H2O contact angle on each of micropit and micro-nano-hybrid surfaces in various ages after UV treatment, showing no significant correlation between them). (C) Electrostatic effects on osteoblast attachment capability of titanium surfaces. UV-treated micropit and micro-nano-hybrid surfaces with different age (fresh and 7-day-old) were tested for cell attachment capability with and without an additional treatment of the surfaces with NaCl solution.
Notes: Data are mean ± SD (n = 3); aP < 0.01, indicating a statistically significant difference between NaCl-treated and untreated surfaces.
![Figure 7 Experimental results addressing the mechanism underlying the sustained high bioactivity of UV-treated micro-nano-hybrid titanium surfaces. Osteoblast attachment after 3 hours (early stage attachment [A] and 24 hours late-stage attachment, [B] incubation plotted against the H2O contact angle on each of micropit and micro-nano-hybrid surfaces in various ages after UV treatment, showing no significant correlation between them). (C) Electrostatic effects on osteoblast attachment capability of titanium surfaces. UV-treated micropit and micro-nano-hybrid surfaces with different age (fresh and 7-day-old) were tested for cell attachment capability with and without an additional treatment of the surfaces with NaCl solution.Notes: Data are mean ± SD (n = 3); aP < 0.01, indicating a statistically significant difference between NaCl-treated and untreated surfaces.](/cms/asset/3c2fc68c-6463-4204-81f5-de46af2f9b5e/dijn_a_22099_f0007_b.jpg)
Figure 8 Age-dependent change of osteoblast attachment to UV-treated micropit surfaces with 50-nm-thin TiO2 coating. (A) SEM images of the 50-nm TiO2 coated micropit surfaces. The number of rat bone marrow–derived osteoblasts attached to titanium surfaces after incubation for 3 hours ([A] early stage attachment) and 24 hours ([B] late-stage attachment), as evaluated by WST-1 colorimetry.
Notes: Data are mean ± SD (n = 3); UV-treated titanium disks of different ages – fresh (immediately after UV treatment), 3-day-old (stored for 3 days in the dark after UV treatment), and 7-day-old surfaces – were tested; the data from micro-nano-hybrid surfaces (300 nm nodules in micropits) are also presented; aP < 0.05, indicating a statistically significant effect of age of titanium.
![Figure 8 Age-dependent change of osteoblast attachment to UV-treated micropit surfaces with 50-nm-thin TiO2 coating. (A) SEM images of the 50-nm TiO2 coated micropit surfaces. The number of rat bone marrow–derived osteoblasts attached to titanium surfaces after incubation for 3 hours ([A] early stage attachment) and 24 hours ([B] late-stage attachment), as evaluated by WST-1 colorimetry.Notes: Data are mean ± SD (n = 3); UV-treated titanium disks of different ages – fresh (immediately after UV treatment), 3-day-old (stored for 3 days in the dark after UV treatment), and 7-day-old surfaces – were tested; the data from micro-nano-hybrid surfaces (300 nm nodules in micropits) are also presented; aP < 0.05, indicating a statistically significant effect of age of titanium.](/cms/asset/4bb9e233-3bbf-43ae-b86c-3d661b39c4d8/dijn_a_22099_f0008_b.jpg)