Figures & data
Table 1 Overview of AuNPs
Figure 1 Phosphatidylserine exposure and membrane permeability of K562, CEM, PBMC, and bone marrow cells after CH-AuNPs treatment. (A) Cell death analysis by flow cytometry using Annexin-V and propidium iodide (PI) staining in K562, CEM, and non-cancer cells, PBMC, and bone marrow treated with different concentrations of CH-AuNPs for 24 hrs. (B) Quantification of cell death assessed as in (A).
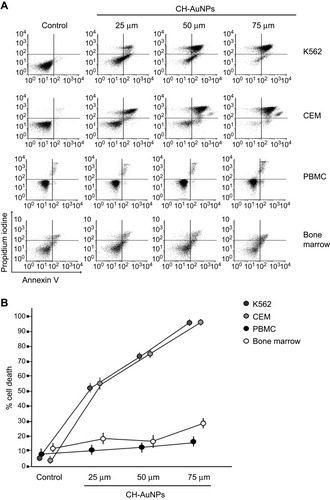
Figure 2 CH-AuNPs induce ROS production. Analysis (left) and quantification (right) of ROS production by flow cytometry using DCFDA staining in K562 and CEM cells treated with CH-AuNPs.
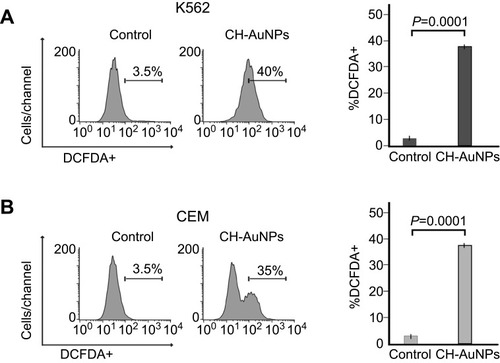
Figure 3 Mitochondrial and nuclear alterations in leukemic cells upon treatment with CH-AuNPs. (A) Mitochondrial membrane potential loss analysis (left) and quantification (right), using TMRE by flow cytometry in K562 and CEM cells after 24 hrs of treatment with CH-AuNPs. (B) Nuclear damage analysis (left) and quantification (right) measured through γ-H2AX by Flow cytometry in K562 and CEM cells. (C) Cell cycle analysis (left) and quantification (right), using propidium iodide (PI) staining in K562 and CEM cells, by flow cytometry after 24 hrs of treatment with CH-AuNPs. (D) DNA degradation analysis, using SubG1 population obtained as in A, by flow cytometry after 24 hrs of treatment with CH-AuNPs.
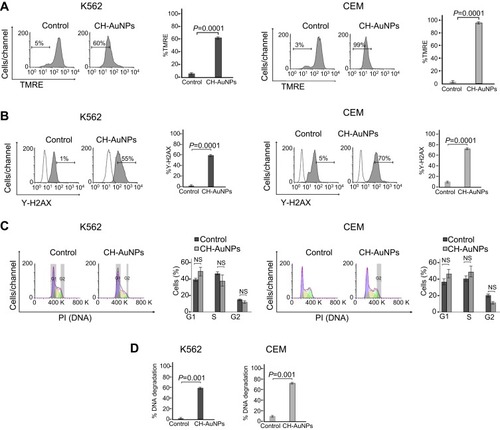
Figure 4 CH-AuNPs induce autophagosomes and caspase-3 activation in leukemic cells. (A) Autophagy assessment through LC3-II analysis (left) and quantification (right), by flow cytometry in K562 and CEM cells treated for 24 hrs with CH-AuNPs. (B) Cleaved caspase-3 analysis (left) and quantification (right), by flow cytometry using FITC-DEVD-FMK staining in K562 and CEM cells at 24 hrs of treatment with CH-AuNPs.
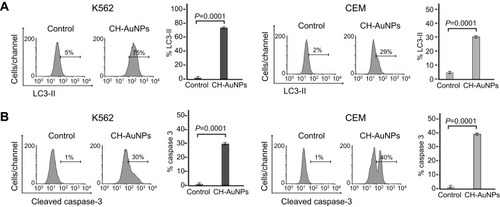
Figure 5 CH-AuNPs treatment induces pro-survival autophagy in K562 and CEM cells. (A) Autophagy assessment through LC3-II analysis (left) and quantification (right), by flow cytometry using Spautin-1 as a specific inhibitor of autophagosomes in K562 and CEM cells treated for 24 hrs with CH-AuNPs. (B) Cell death analysis (left) and quantification (right) by flow cytometry using Annexin-V and propidium iodide (PI) staining in K562 and CEM cells treated with CH-AuNPs and Spautin-1.
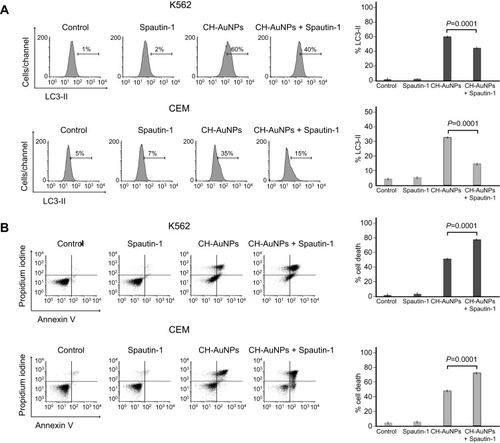
Figure 6 Role of apoptosis and autophagy in K562 and CEM cells after CH-AuNPs treatment. (A) Cleaved caspase-3 analysis (left) and quantification (right), using QVD as a pan-caspase inhibitor, in K562 and CEM cells at 24 hrs of treatment with CH-AuNPs. (B) Cell death analysis (left) and quantification (right) using QVD in K562 and CEM cells after CH-AuNPs for 24 hrs. (C) Cell death analysis (left) and quantification (right) during inhibition with Spautin-1 (autophagy inhibitor) and QVD (pan-caspase inhibitor) in K562 and CEM cells treated with CH-AuNPs.
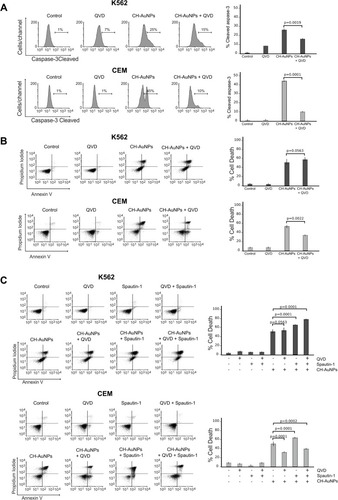
Figure 7 Role of necroptosis and autophagy in leukemic cells treated with CH-AuNPs. (A) Cell analysis (left) and quantification (right) using Necrostatin-1 (Nec-1) as a necrosome inhibitor and QVD (pan-caspase inhibitor) in K562 and CEM cells treated with CH-AuNPs. (B) Cell death analysis (left) and quantification (right) during inhibition with Spautin-1 (autophagy inhibitor) and Nec-1 (necrosome inhibitor) in K562 and CEM cells treated with CH-AuNPs.
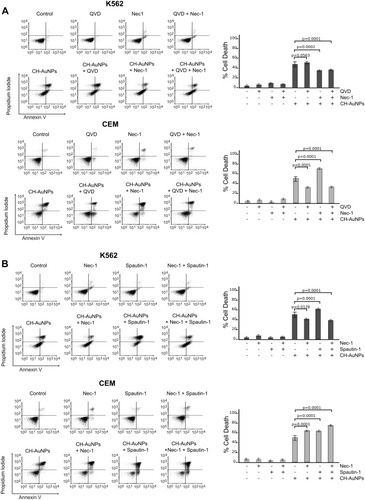
Figure 8 Effect of ROS production in the biochemical characteristics of cell death induced by CH-AuNPs in K562 and CEM cells. (A) Analysis and quantification ROS by flow cytometry using DCFDA staining and N-acetyl-cysteine (NAC) as a ROS inhibitor in K562 and CEM cells treated with CH-AuNPs. (B) Mitochondrial membrane potential loss analysis and quantification by Flow cytometry using TMRE staining and NAC (ROS inhibitor) in K562 and CEM cells after 24 hrs of treatment with CH-AuNPs. (C) Nuclear damage analysis and quantification measured through γ-H2AX using NAC in K562 and CEM cells. (D) Cleaved caspase-3 analysis (left) and quantification (right) during ROS inhibition (NAC) by flow cytometry in K562 and CEM cells after 24 hrs of treatment with CH-AuNPs.

Figure 9 Role of ROS in the cell death induced by CH-AuNPs in leukemic cells. Cell death analysis and quantification by flow cytometry using Annexin-V and propidium iodide (PI) staining in K562 and CEM cells treated with different concentrations of CH-AuNPs for 24 hrs during ROS inhibition with NAC.
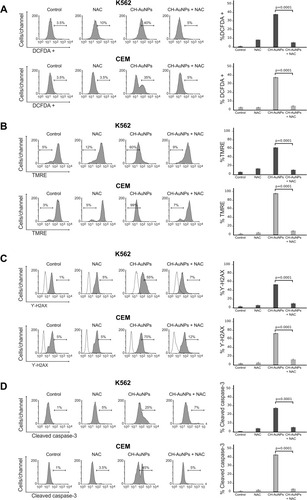
Figure 10 Cell death mechanism induced by CH-AuNPs in leukemic cells. (A) In K562 cells, CH-AuNPs induce ROS production that are inhibited using NAC. ROS production leads to loss of mitochondrial membrane potential, caspase-3 activation, and nuclear alterations. Nuclear alterations include DNA damage (γ-H2Ax) and degradation. During, apoptosis inhibition with QVD, cell death is maintained while it is inhibited with necrostatin-1. (B) In CEM cells, CH-AuNPs generate ROS production (inhibited with NAC) leading to caspase-dependent cell death. ROS production induces loss of mitochondrial membrane potential, DNA damage (γ-H2Ax) and degradation, and cleaved of caspase-3 to trigger cell death. Finally, QVD inhibits the cell death induced by CH-AuNPs. In A and B, pro-survival autophagy is activated.
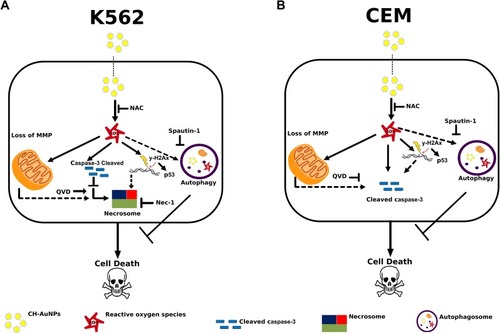
Figure S1 Size and plasmon resonance.
Note: Representative size distribution obtained from DLS analysis. (B) UV-Vis absorption spectrum.
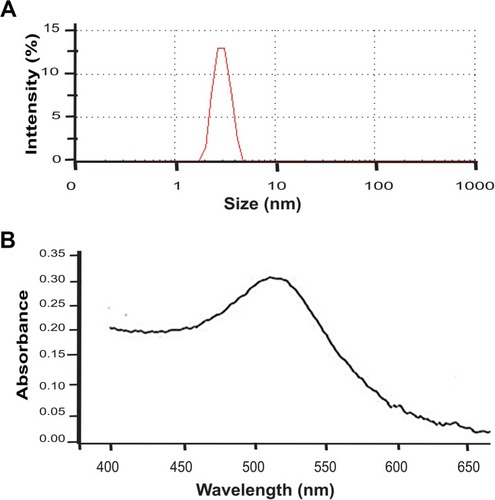
Figure S2 Effect of Chitosan, AuHCl4, and SC-AuNPs on K562 and PBMC cell viability.
Notes: K562 (A), and PBMC (B) were treated with Chitosan (CH), HAuCl4, and Sodium-citrate nanoparticles (SC-AuNPs) for 24 hours. Cell death was measured by Flow cytometry, and the means of triplicates were graphed.

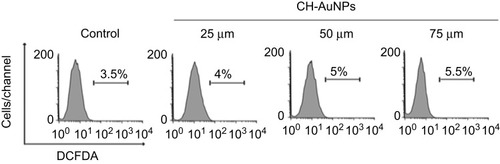
Figure S3 ROS analysis in PBMC cells treated with CH-AuNPs.
Note: Analysis of ROS by Flow cytometry using DCFDA staining in PBMC treated with CH-AuNPs.