Figures & data
Figure 1 Increased miR-425-3p expression in serum exosomes from NSCLC patients during the course of platinum-based chemotherapy. Circulating exosomes were derived from paired serum samples of NSCLC patients (A) at the start of treatment (non-resistant) and at the date of disease progression (resistant) (n = 38 samples from 19 patients) or (B) of NSCLC patients receiving the first and last cycle of treatment before diagnosed as drug-resistant (n = 30 samples from 15 patients), respectively. The absolute concentrations of miR-425-3p in exosomes were evaluated by qRT-PCR. Each point represents one sample. **P < 0.01; ***P < 0.001.
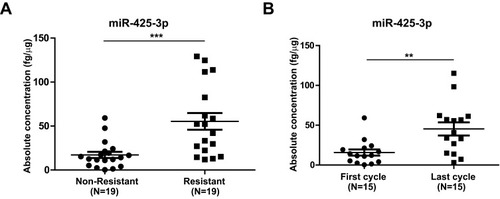
Figure 2 Cisplatin stimulates exosome release and its miR-425-3p expression in NSCLC cell lines. (A-C) A549 cells were exposed to various concentrations of cisplatin for 48 h. (A) Intracellular miR-425-3p expression were evaluated by qRT-PCR. (B) Quantity of exosomes from cultured cells were determined using BCA protein assay and normalized to cell numbers. (C) The absolute concentrations of miR-425-3p in exosomes were evaluated by qRT-PCR. (D, E) Cisplatin-resistant variant cells were maintained at a final concentration of cisplatin (500–2000 ng/mL). (D) Intracellular miR-425-3p expression in the variant cells. (E) Quantity of exosomes from the cultured variant cells. *P < 0.05; **P < 0.01; ***P < 0.001.
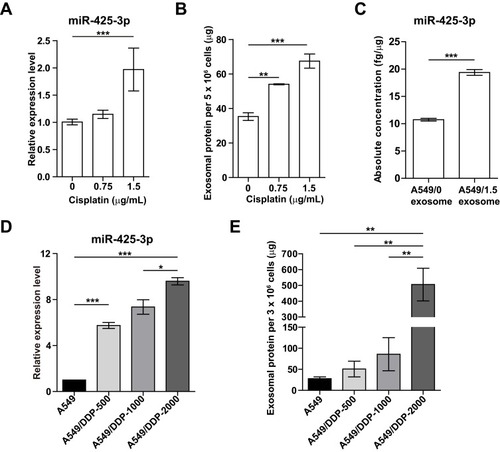
Figure 3 Exosomal miR-425-3p decreases the sensitivity of A549 cells to cisplatin. (A) Representative confocal microscopy image showing the internalization of CM-Dil-labeled exosomes (red) by A549 cells. A549 cells were incubated with exosomes isolated from A549 cells exposed to the indicated concentration of cisplatin or from cisplatin-resistant variant cells for 6 h. Then the resulting cells were treated with various concentrations of cisplatin for 72 h. (B, E) Cell viability was determined by MTT assay in triplicate. An extra sum-of-squares F-test was performed to test whether dose-response curves statistically differ from PBS control. P < 0.05, (B) A549/1.5 exosome vs PBS; (E) A549/DDP-1000 or −2000 exosome vs PBS. (C, F) Intracellular miR-425-3p expression were evaluated by qRT-PCR. (D, G) Enhanced sensitivity to cisplatin in the treated cells after transfection of the miR-425-3p inhibitor. An extra sum-of-squares F-test was performed to test whether dose-response curves statistically differ from NC control. P < 0.05, (D) NC + A549/1.5 exosome vs NC; (G) NC + A549/DDP-1000 exosome vs NC. (H) Analysis of cell apoptosis by annexin V/PI double staining. Left, exosome-treated A549 cells were exposed to 2 μg/mL of cisplatin for 24 h. FACS analyses were performed. Right, statistical graph analysis. (I) Enhanced apoptosis in the treated cells after transfection of the miR-425-3p inhibitor. Upper, representative data of FACS. Lower, statistical graph analysis. (J) Enhanced cleavage of PARP in the treated cells after transfection of the miR-425-3p inhibitor was assessed using Western blotting. β-actin was used as a loading control. The densitometry of the immunoblots was performed with image J software and is presented in the histograms. The data are shown as the mean ± SD of three independent experiments. *P < 0.05; **P < 0.01; ***P < 0.001.
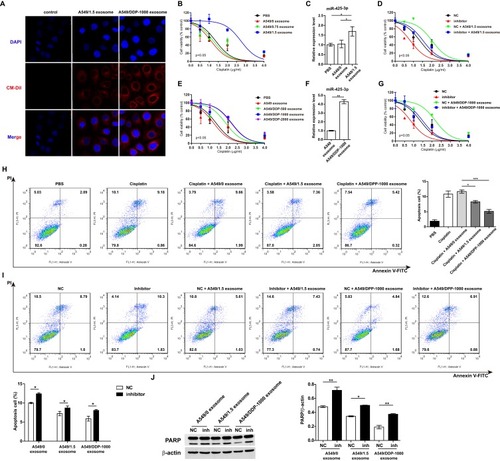
Figure 4 Cisplatin enhances miR-425-3p expression by activating the β-catenin pathway. (A) A549 cells were exposed to various concentrations of cisplatin for 24 h. The protein levels of phosphorylated β-catenin (p-β-catenin), β-catenin and c-Myc were assessed using Western blotting. β-actin was used as a loading control. (B) Western blotting analysis showing protein expression of c-Myc in the cisplatin-resistant variant cells. (C) Knockdown of c-Myc in A549 cells transfected with c-Myc-targeting siRNA. Left, the protein level of c-Myc. Right, the mRNA level of c-Myc. (D) A549 cells transfected with c-Myc siRNA were treated with 1.5 μg/mL of cisplatin for 24 h. Then intracellular miR-425-3p expression were evaluated by qRT-PCR. The data are shown as the mean ± SD of three independent experiments. *P < 0.05; **P < 0.01; ***P < 0.001.
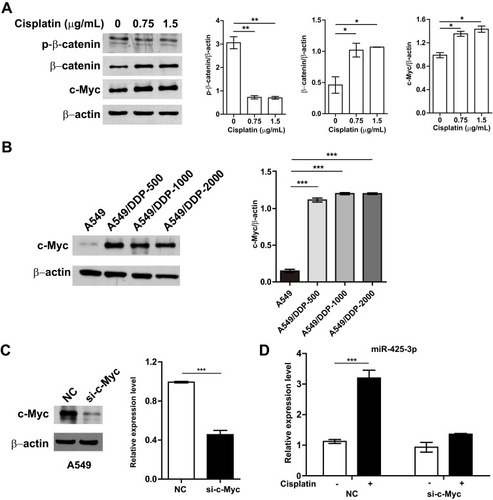
Figure 5 c-Myc transactivates miR-425-3p via its binding to the miR-425-3p promoter. (A) A549 cells were treated with 1.5 μg/mL of cisplatin for 24 h. ChIP assays were performed using an antibody against c-Myc, followed by qRT-PCR with primers designed for c-Myc-binding sites in miR-425-3p promoter regions. (B) ChIP analysis showing the binding of c-Myc to the miR-425-3p promoter in A549 and A549/DDP-1000 cells. (C) Schematic of a luciferase reporter of the miR-425-3p promoter with 5 predicted c-Myc binding sites (wide type). Mutated luciferase plasmids were designed with depletion of 2 predicted binding sites. (D) A549 cells transfected with the wide-type (WT) or mutated (Mut) plasmids were treated with or without 1.5 μg/mL of cisplatin for 24 h. Luciferase activity was detected. (E) A549 cells co-transfected with the WT plasmids or NC and c-Myc siRNA were treated with or without 1.5 μg/mL of cisplatin for 24 h. Luciferase activity was detected. The data are shown as the mean ± SD of three independent experiments. *P < 0.05; **P < 0.01; ***P < 0.001.
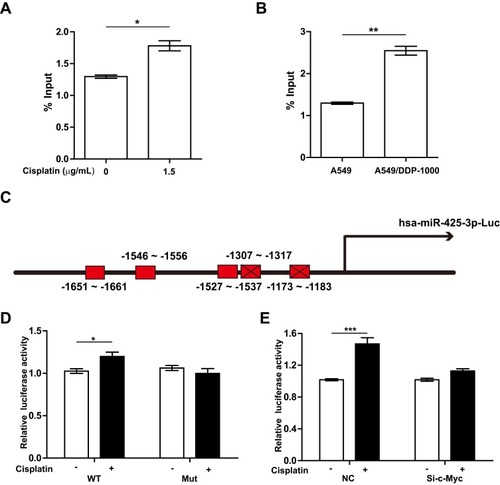
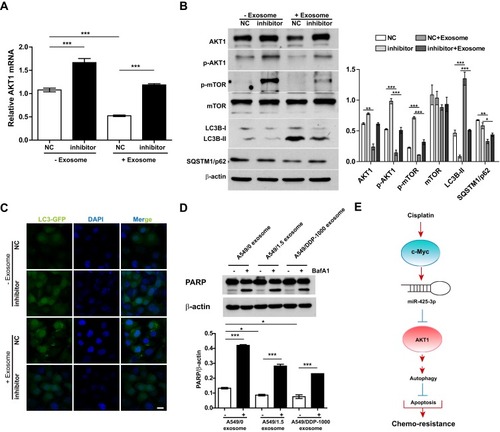
Figure 6 Exosomal miR-425-3p-activated autophagy contributes to apoptosis resistance in the recipient A549 cells. (A, B) A549 cells transfected with NC or the miR-425-3p inhibitor were incubated with or without A549/DDP-1000 exosome for 24 h. (A) qRT-PCR analysis for AKT1 mRNA expression. (B) Western blotting analysis showing protein expression of AKT1, p-AKT1, p-mTOR, mTOR, LC3B and SQSTM1/p62. β-actin was used as a loading control. (C) A549 cells co-transfected with the GFP-LC3 plasmid and NC or the miR-425-3p inhibitor were incubated with or without A549/DDP-1000 exosome for 24 h. Representative images show GFP-LC3 localization. Scale bar: 5 μm. (D) A549 cells were pretreated with BafA1 (100 nM) for 2 h and incubated with indicated exosomes 6 h. The resulting cells were exposed to 2 μg/mL of cisplatin for another 24 h. The protein levels of PARP were assessed using Western blotting. β-actin was used as a loading control. (E) Schematic representation of the mechanism by which cisplatin-induced miR-425-3p confers chemoresistance via exosome transfer in NSCLC. The data are shown as the mean ± SD of three independent experiments. *P < 0.05; **P < 0.01; ***P < 0.001.