Figures & data
Table 1 Levels and Code of Variables Chosen for Box–Behnken Design
Table 2 The Design and Results of Box–Behnken Experiments
Table 3 ANOVA for Response Surface Quadratic Model
Figure 1 2-D contour plots and 3-D response surface plots showing the effects of various parameters on EE. (A and B) The effects of X1 and X2 on EE. (C and D) The effects of X1 and X3 on EE. (E and F) The effects of X2 and X3 on EE.
Abbreviations: X1, lipid-to-cholesterol molar ratio; X2, doses of DSPE-PEG2000; X3, lipid-to-drug weight ratio; EE, encapsulation efficiency.
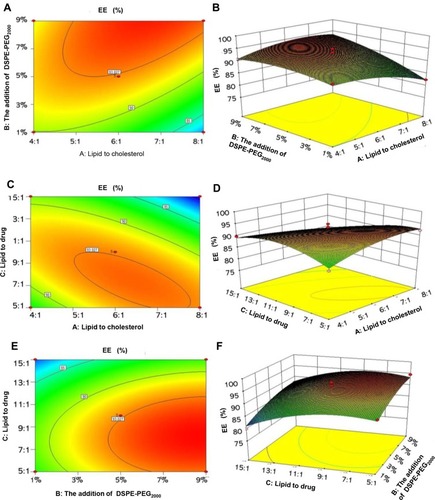
Figure 2 Particle size and morphology of the optimized pRL. (A) Morphology of the pRL observed by TEM. (B) Particle size of the optimized pRL was measured by DLS.
Abbreviations: pRL, PEGylation nano-RGP; DLS, dynamic light scattering; TEM, transmission electron microscopy.
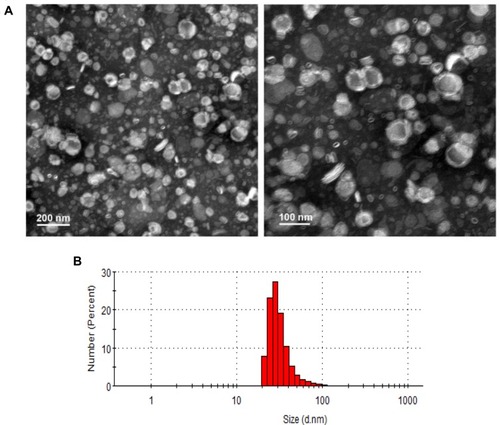
Table 4 The Effects of Different Lyoprotectants on Formability and Redispersibility of the Lyophilized pRL
Table 5 Comparision of the EE and the Retention Rate Under Different Lipid-to-Cryoprotectant Ratios
Figure 3 (A) Cell viability of RAW264.7 in the stimulation of pRL, RL, BL and RGP at 450nm. LPS was the positive control and the BC was the negative control. (B-E) The effects of pRL on the secretion of IL-6, IL-12, IL-1β and TNF-α. (**P<0.01).
Abbreviations: pRL, PEGylation nano-RGP; RL, nano-RGP without PEGylation; BL, blank nano-vehicle; RGP, Rehmannia glutinosa polysaccharide; LPS, lipopolysaccharide; BC, blank control.
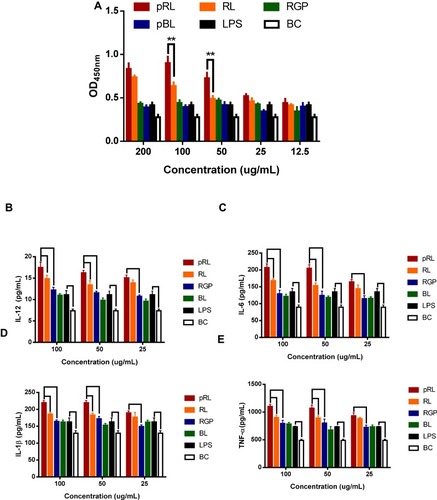
Figure 4 Cellular uptake of RAW264.7 cell lines. (A) The intracellular uptake and subcellular distribution of DiD-labeled pRL (50 μg/mL) were investigated after 4hr incubation under the confocal (Green: LysoTracker) (upper line: the scale bar is 50 μm. Lower line: the scale bar is 20 μm). (B) The intracellular uptake of DiD-labeled pRL was quantified by flow cytometry. (C) The quantification data of the flow cytometry results (***P<0.001).
Abbreviation: pRL, PEGylation nano-RGP.
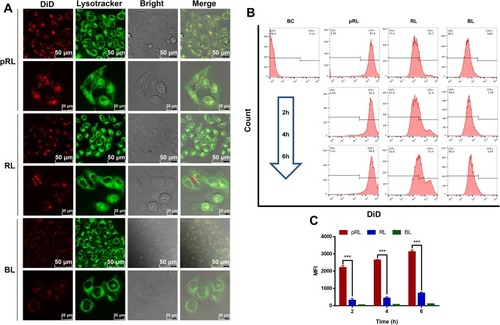
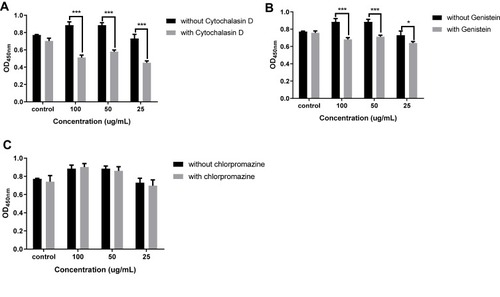
Figure 5 pRL internalized cell via the macropinocytosis- and caveolae-mediated endocytotic pathway. The changes in cell viability by cytochalasin D (A), genistein (B) and chlorpromazine (C) were measured by CCK-8 method (*P<0.05, ***P<0.001).
Abbreviation: pRL, PEGylation nano-RGP.