Figures & data
Figure 1 Characterization of UCNPs and UCNPs@mSiO2. (A) Schematic drawing showing the fabrication process of UCNPs@mSiO2-Ce6-GPC3. (B) XRD patterns of UCNPs, UCNPs@mSiO2 and the standard XRD pattern of NaGdF4 (JCPDS No.27–0699). Representative transmission electron microscope images of (C, a) NaGdF4:Yb, Er, (C, b) NaGdF4:Yb, Er@NaGdF4:Yb, (C, c) NaGdF4:Yb, Er@NaGdF4:Yb@NaNdF4:Yb (UCNPs) and (C, d) NaGdF4:Yb, Er@NaGdF4:Yb@NaNdF4:Yb @mSiO2(UCNPs@mSiO2).
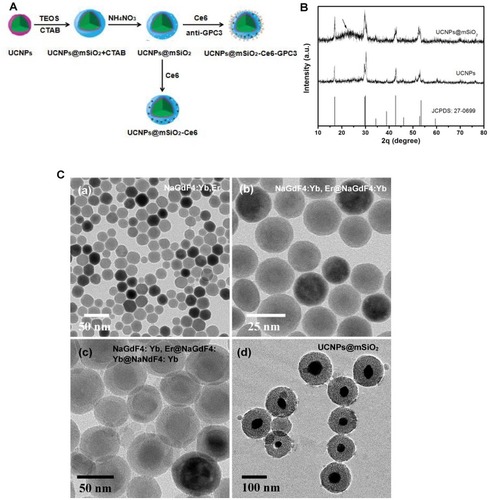
Figure 2 (A) UV−vis absorbance spectra of Ce6, UCNPs@mSiO2 and UCNPs@mSiO2-Ce6. (B) The ultraviolet absorption spectra at 650 nm of the UCNPs@mSiO2-Ce6 (1 mg/mL) before and after centrifugation (2000 rpm, 5 mins) once a day to evaluate the stability of Ce6. (C) Upconversion luminescence spectra of UCNPs@mSiO2 and UCNPs@mSiO2-Ce6 under 808 nm excitation recorded at the same UCNPs concentration. (D) Decay curves of UCNPs@mSiO2 and UCNPs@mSiO2-Ce6 at the wavelength of 650 nm under 808 nm excitation.
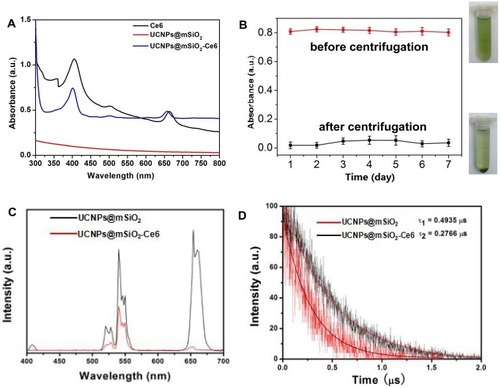
Figure 3 (A) FT-IR spectra of UCNPs@mSiO2 (black line), UCNPs@mSiO2-Ce6 (red line) and UCNPs@mSiO2-Ce6-GPC3 (blue line). (B) Zeta potential of UCNPs@mSiO2, UCNPs@mSiO2-Ce6 and UCNPs@mSiO2-Ce6-GPC3.
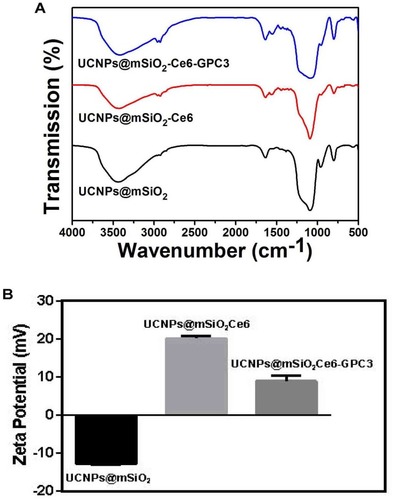
Figure 4 Confocal images of normal liver L02 cells and liver cancer HepG2 cells after co-incubation with DAPI and UCNPs@mSiO2-Ce6-GPC3. The incubation time was 0.5 h, 1 h, 3 h; The left was the DAPI staining; The middle was the UCNPs@mSiO2-Ce6-GPC3 image; The right was the overlay image of co-incubation with DAPI and the UCNPs@mSiO2-Ce6-GPC3, scale bar 40 μm.
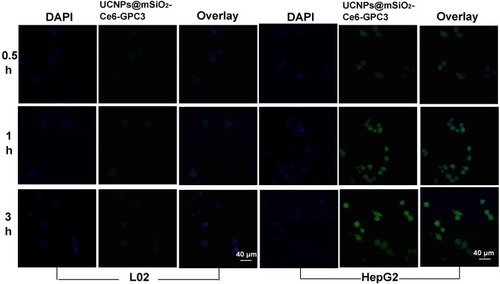
Figure 5 (A) The MTT assay using L02 cell lines incubated with different concentrations of UCNPs@mSiO2, UCNPs@mSiO2-Ce6 and UCNPs@mSiO2-Ce6-GPC3. (B) The hemolysis assay of UCNPs@mSiO2-Ce6-GPC3 using human blood red cells.
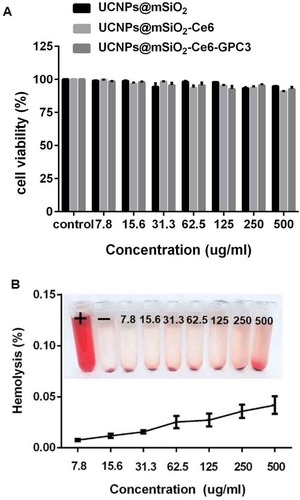
Figure 6 In vitro cell viability of HepG2 cells after treating with RPMI1640 medium (control group), 808 nm NIR, varied concentrations of UCNPs@mSiO2, Ce6, UCNPs@mSiO2-Ce6 and UCNPs@mSiO2-Ce6-GPC3 plus 808 nm NIR (*P<0.05, **P<0.01).
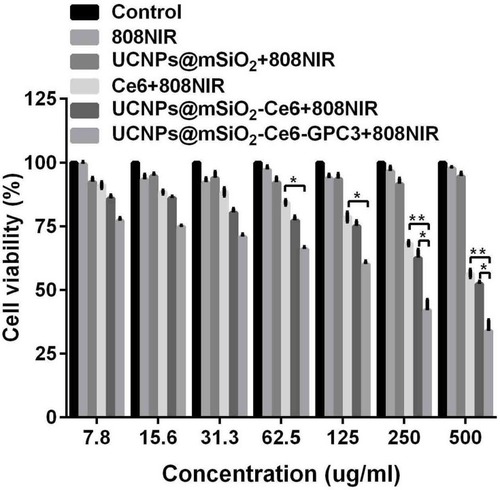
Figure 7 In vivo anti-cancer properties. (A) The body weight and (B) the tumor volume of nude mice in different groups versus the treatment time (*P<0.05 compared to control groups). (C) Tumor size in each treatment group. (D) Representative digital photographs of tumor-bearing mice and tumor tissue excised from tumor-bearing mice treated with (1) Control (normal saline), (2) 808 nm NIR, (3) Ce6+808 nm NIR, (4) UCNPs@mSiO2-Ce6+808 nm NIR and (5) UCNPs@mSiO2-Ce6-GPC3+808 nm NIR irradiation on the 14th day.
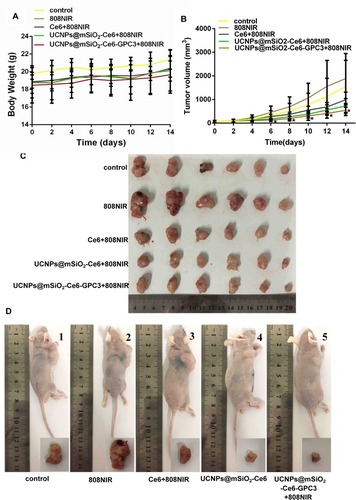
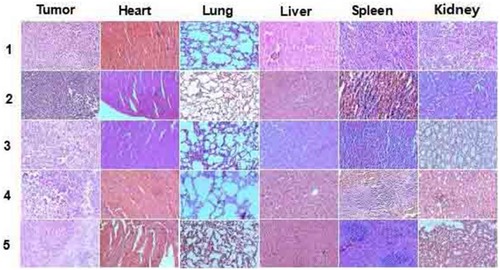
Figure 8 H&E-stained images of tumor, heart, lung, liver, spleen and kidney collected from different groups ((1) control (normal saline), (2) 808 nm NIR, (3) Ce6+808 nm NIR, (4) UCNPs@mSiO2-Ce6+808 nm NIR and (5) UCNPs@mSiO2-Ce6-GPC3+808 nm NIR) on the 14th day.