Figures & data
Scheme 1 Two step production of βCDSH.
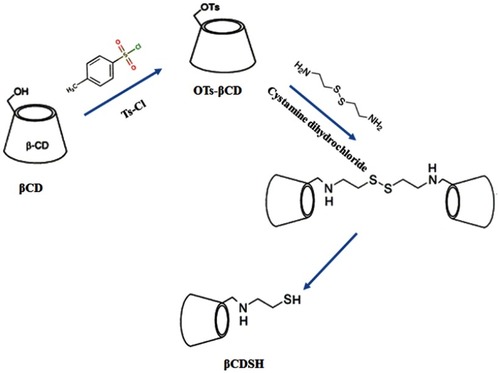
Figure 1 FE-SEM analysis of γ-Fe2O3.
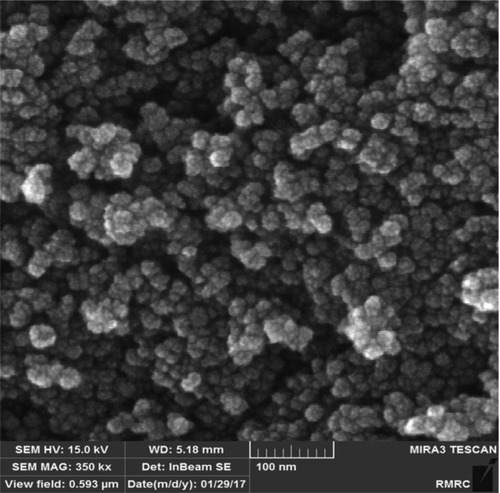
Figure 2 (A) Changing the solution color before and after of Au addition, (B) UV-Visible spectroscopy of five Au iterations.
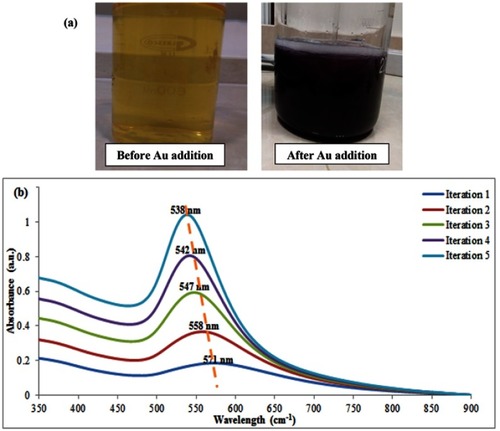
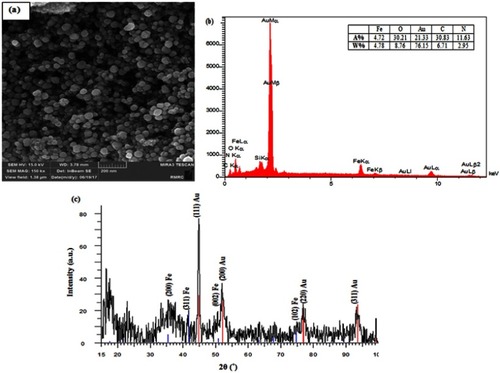
Figure 3 (A) FE-SEM, (B) EDX and (C) XRD of γ-Fe2O3@Au core-shell nanoparticles.
Scheme 2 The formation of an inclusion complex between βCD and SDN.
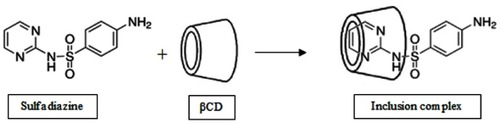
Figure 4 Change in the color of nano-system before and after removing the Au.
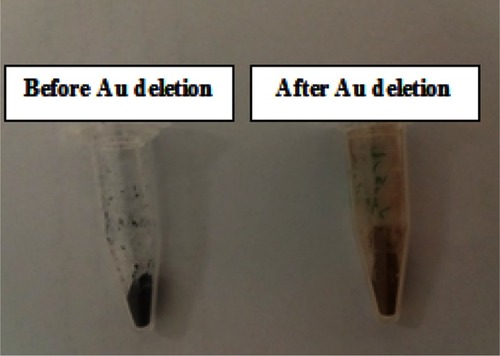
Figure 5 FTIR results of (A) γ-Fe2O3@Au/PβCD (B) γ-Fe2O3@Au/PβCD, γ-Fe2O3@Au/PβCD/PAA-SDN, physical mixture, PAA-SDN, (C) γ-Fe2O3@Au/PβCD/PAA-SDN, γ-Fe2O3@Au/PβCD/PAA-SDN/PEI-βCD, physical mixture, PEI-βCD, and (D) nanocapsule.
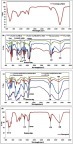
Figure 6 The XRD results of (A) γ-Fe2O3@Au/PβCD, (B) γ-Fe2O3@Au/PβCD, PAA-SDN, γ-Fe2O3@Au/PβCD/PAA-SDN, physical mixture of γ-Fe2O3@Au/PβCD and PAA-SDN and (C) γ-Fe2O3@Au/PβCD/PAA-SDN/PEI-βCD, γ-Fe2O3@Au/PβCD/PAA-SDN, PEI-βCD and physical mixture.
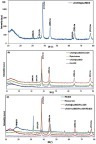
Table 1 Charge variation of the nano-system by addition of different layers
Figure 7 FE-SEM result of (A) γ-Fe2O3@Au/PβCD, (B) γ-Fe2O3@Au/PβCD/PAA-SDN, (C) γ-Fe2O3@Au/PβCD/PAA-SDN/PEI-βCD and (D) nanocapsule.
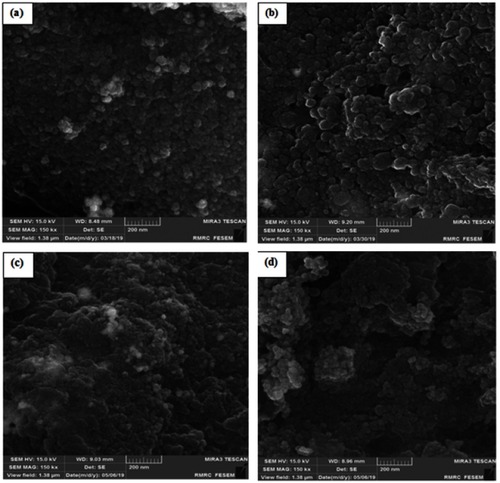
Figure 8 EDX analysis of (A) γ-Fe2O3@Au/PβCD, (B) γ-Fe2O3@Au/PβCD/PAA-SDN, (C) γ-Fe2O3@Au/PβCD/PAA-SDN/PEI-βCD and (D) Nanocapsule.
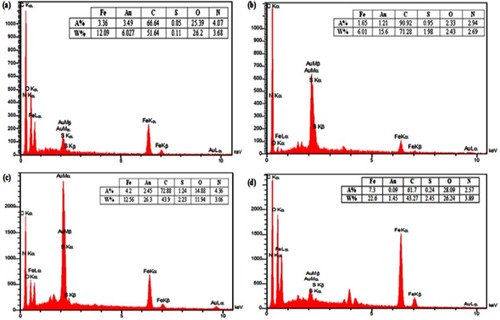
Table 2 Entrapment efficiency (EE) and the loading efficiency (LE) percentage of drug in nanocapsule at two pH with different mass ratios
Figure 9 Zeta potential curve of nanocapsule with drug.
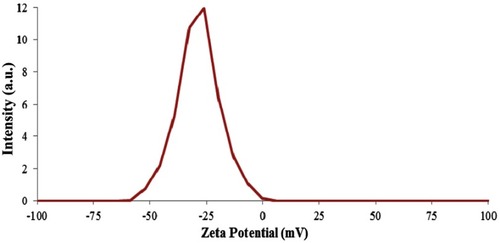
Figure 10 In vitro release profile of doxorubicin from (A) Sample, 1, (B) Sample 2 and (C) Sample 3, in PBS in two different pH 7.4 and 6.6.
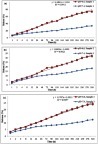
Figure 11 Results of MTT assay on (A) L929 and (B) MCF-7 cell lines (*P≤0.05).
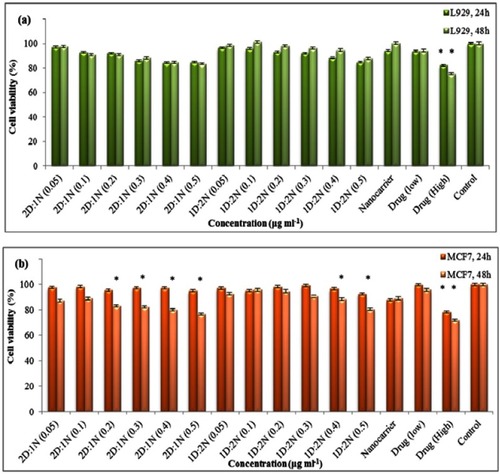
Figure 12 Hemolysis results of sample 1 and sample 3.
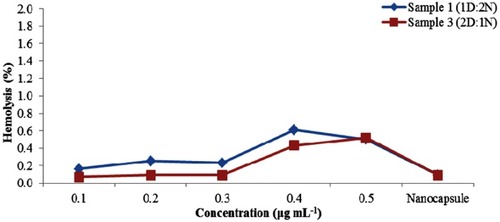
Figure 13 Effect of different concentrations of nanocapsule on (A) C3, (B) C4.
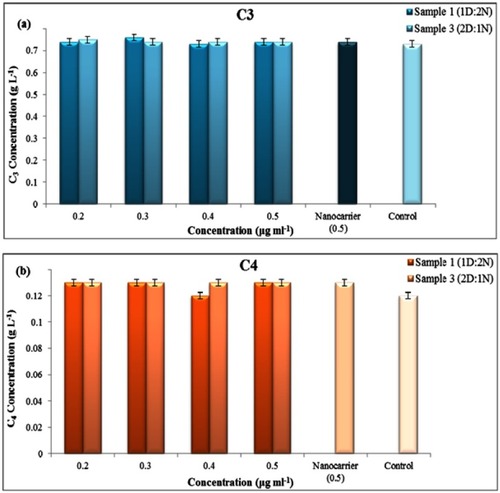
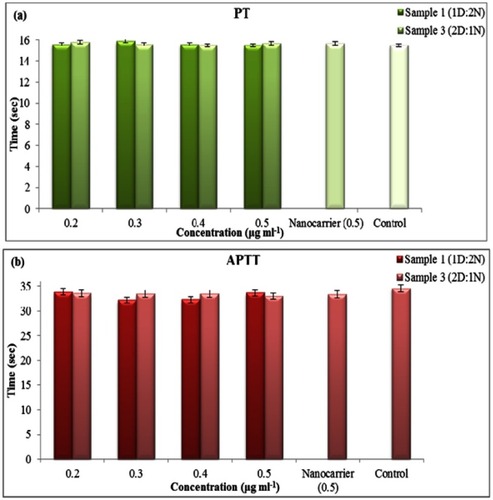
Figure 14 Effect of different concentrations of nanocapsules on (A) PT and (B) APTT.