Figures & data
Figure 1 Characterization and loading and releasing properties of BTM@PEG-PE micelles. (A) The TEM image of BTM@PEG-PE micelles. (B) The size distribution of BTM@PEG-PE micelles. (C) Drug loading properties of BTM@PEG-PE micelles. (D) The core-shell structure of BTM@PEG-PE micelles. (E) Drug releasing properties of BTM@PEG-PE micelles at pH 7.4 and pH 5.0.
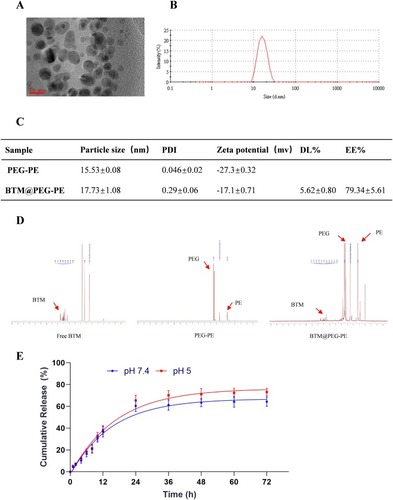
Figure 2 In vitro cellular uptake of C6@PEG-PE micelles. Cells were incubated with C6@PEG-PE micelles for 1 h, 2 h or 4 h before imaging and flow cytometry analysis. (A) uptake of C6 and C6@PEG-PE micelles incubation in CT26 cells, green indicates C6 or C6@PEG-PE micelles while blue indicates the nucleus. (B) Mean C6 fluorescence of CT26 cells incubated with C6 or C6@PEG-PE for 1, 2, 4 h. (C) Fluorescence intensity when CT26 cells were treated with C6 or C6@PEG-PE for 4 h. Data were presented as mean ± SD of three independent experiments.
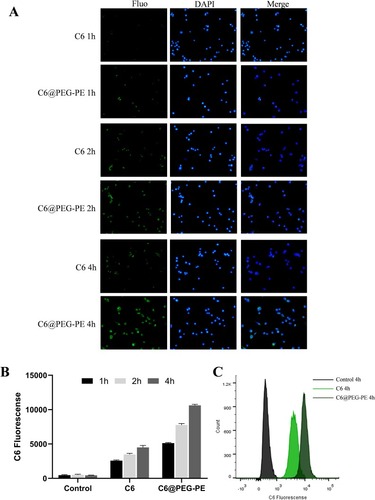
Figure 3 In vitro antitumor activity of BTM and BTM@PEG-PE micelles. CT26 cells were treated over 24 or 48 h with PEG-PE or free BTM or BTM@PEG-PE micelles. Relative viability was measured by MTS assay and each point represents the mean ± SD of six independent experiments. (A) Effects of increasing concentrations of BTM@PEG-PE micelles on CT26 cells viability. (B) Effects of increasing concentrations of BTM@PEG-PE micelles on L02 cells viability. (C) Calculated IC50 of BTM@PEG-PE micelles on CT26 cells viability. (D) Comparison of effects of free BTM BTM@PEG-PE micelles on CT26 cells viability at the equivalent highest free BTM concentration (4.97 μM). (E) Caspase 3 activity of CT26 cells after treatment of 24 h. Each point represents the mean ± SD, **P<0.01, ***P<0.001, ****P<0.0001.
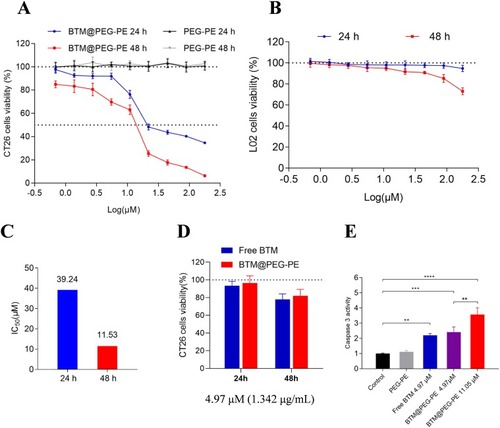
Figure 4 Apoptosis and cell cycle assay. (A) Apoptosis was analyzed using an Annexin V/PI staining kit. (B) Cell cycle was analyzed using a BrdU FITC assay.
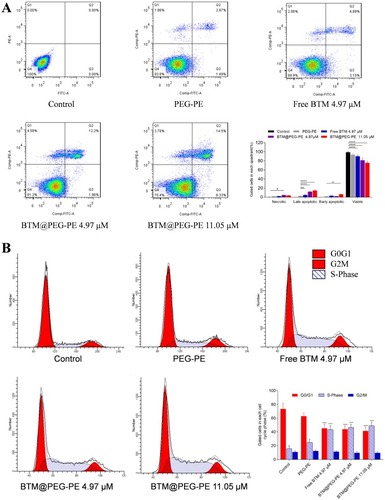
Figure 5 Pharmacokinetic profiles of free BTM and BTM@PEG-PE micelles after intravenous injection (N=5). (A) Plasma concentration-time curve of free BTM and BTM@PEG-PE micelles. (B) Pharmacokinetic parameters of free BTM and BTM@PEG-PE micelles. Each point represents the mean ± SD, **P<0.01, ***P<0.001, ****P<0.0001.
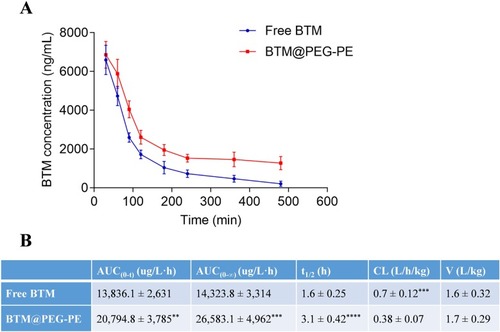
Figure 6 Therapeutic efficacy of BTM@PEG-PE micelles against CT26 tumors (N=10). (A) Tumor growth in mice during the experimental period. (B) Change of bodyweight of tumor-bearing mice (N=10). (C) Excised tumors at the end of experiments (N=5). (D) Tumor weight at the end of experiments (N=5). (E) Survival analysis of tumor-bearing mice after treatment of different formulations (N=6). Each point represents the mean ± SD, *P<0.05, ***P<0.001, ****P<0.0001; ns, not significant.
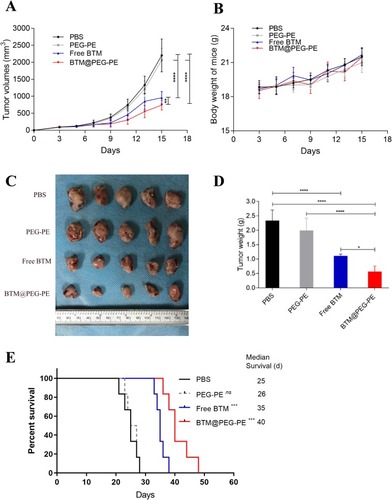
Figure 7 Histopathological confirmation of efficient therapeutic efficacy of BTM@PEG-PE micelles against CT26 tumor. H&E and TUNEL-stained tumors of mice after treatment (scale bar =500 μm).
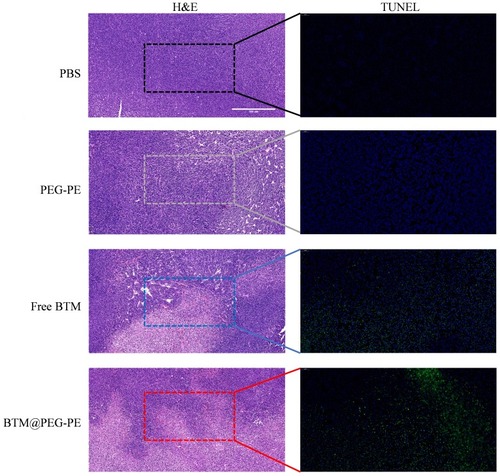
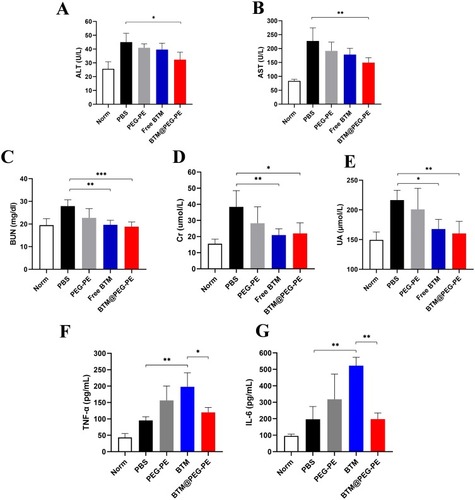
Figure 8 Safety and biocompatibility evaluation of free BTM and BTM@PEG-PE micelles. Plasma levels of (A) ALT, (B) AST, (C) BUN, (D) Cr, (E) UA, (F) TNF-α and (G) IL-6 in tumor-bearing mice two days after treatment, n=5. Each point represents the mean ± SD, *P<0.05, **P<0.01, ***P<0.001.