Figures & data
Figure 1 Schematic diagram of an Alzheimer’s diagnosis system using a molecular buffer and bus network.
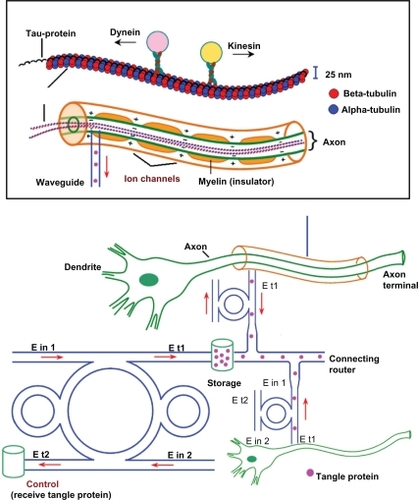
Figure 2 Schematic of microtubule and optical waveguide position in the axon.
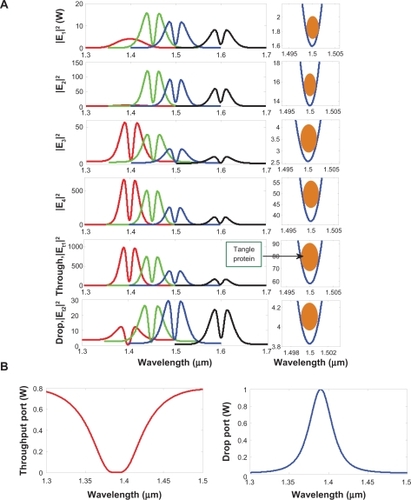
Figure 3 Result of the dynamic tweezers within the buffer with different (A) wavelengths and (B) coupling constants, where Rad = 20 μm, RR = RL = 5 μm.
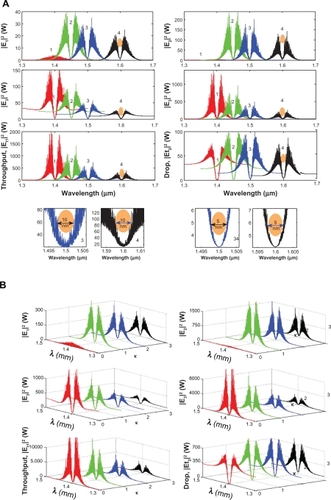
Figure 4 Result of the dynamic tweezers within the buffer with different (A) coupling constants and (B) The optical potential well of throughput and norm of drop port, where Rad = 1 μm, RR = RL = 800 nm.