Figures & data
Table 1 The Characterization Of Micelles And Cationic Nanoemulsions By Droplet Size, Polydispersity Index (PDI), And Zeta Potential
Figure 1 The physicochemical characteristics of micelles and squalene@CPC nanoemulsions: (A) the size change of micelles and nanoemulsions at 50 °C and 75% relative humidity for 14 days; and (B) fluorescence emission of Nile red incorporation in micelles and nanoemulsions for determining molecular environment polarity. The stability data are presented as the mean of four experiments±S.D.
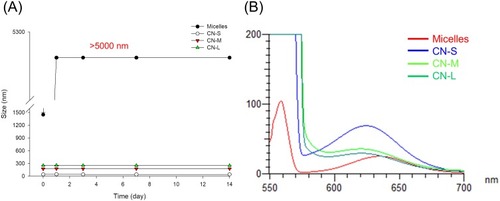
Table 2 The Minimum Inhibitory Concentration (MIC, µg/mL) And Minimum Bactericidal Concentration (MBC, µg/mL) Of Cetylpyridinium Chloride (CPC) In Micelles And Cationic Nanoemulsions Against Different Strains Of Bacteria
Figure 2 Determination of the antibacterial activity of micelles and squalene@CPC nanoemulsions against planktonic MRSA: (A) zone of inhibition measured from agar diffusion assay; (B) morphological changes of MRSA viewed under SEM; and (C) the enlarged images of B. The agar diffusion data are presented as the mean of three experiments±S.D.
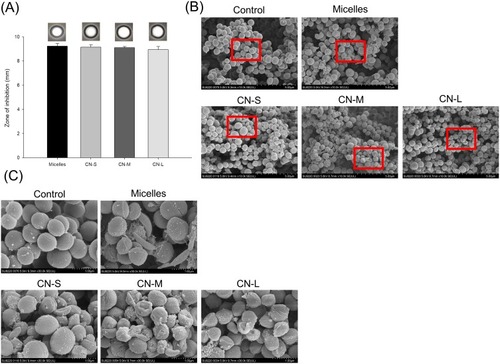
Figure 3 The live/dead imaging by treatment of micelles and squalene@CPC nanoemulsions against planktonic MRSA: (A) treatment with CPC at 10 μg/mL; and (B) treatment with CPC at 100 μg/mL.
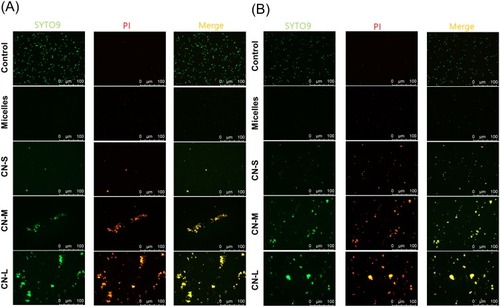
Figure 4 Determination of the antibacterial activity of micelles and squalene@CPC nanoemulsions against biofilm MRSA: (A) MRSA CFU inside the biofilm; (B) MRSA CFU outside the biofilm; (C) the three-dimensional images of biofilm visualized by confocal microscopy; (D) the corresponding biofilm green intensity; and (E) the corresponding biofilm thickness. All data are presented as the mean of three experiments±S.D. ***p < 0.001; **p < 0.01; *p < 0.05.
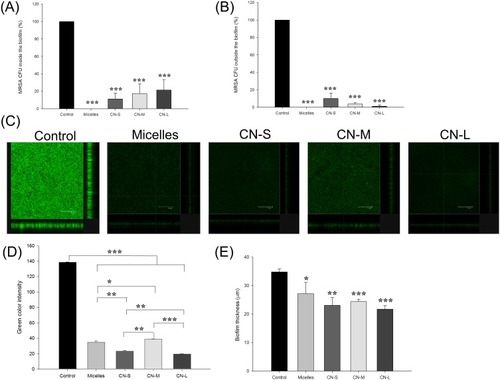
Table 3 Differentially Expressed Proteins In MRSA Following The Treatments Of Micelles And Cationic Nanoemulsions
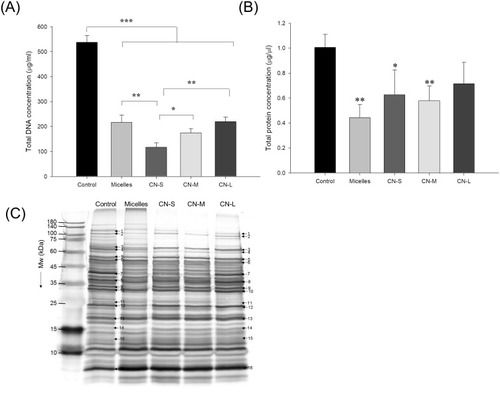
Figure 5 The genomic and proteomic profiles of MRSA treated by micelles and squalene@CPC nanoemulsions: (A) analysis of the quality of MRSA genomic DNA by agarose gel electrophoresis; (B) total protein concentration in MRSA; and (C) the protein change of MRSA analyzed by SDS-PAGE and MALDI-TOF/TOF mass. All data are presented as the mean of three experiments±S.D. ***p < 0.001; **p < 0.01; *p < 0.05.