Figures & data
Figure 1 Synthesis and characterization of AgNPs. (A) UV-Visible spectra analysis confirming the synthesis of AgNPs. Inset showing test tubes after the formation of AgNPs at different concentration of silver nitrate solution. (B, C) TEM images of ss-AgNPs and ls-AgNPs, respectively. (D, E) Particle size distribution histogram of AgNPs determined using TEM images.
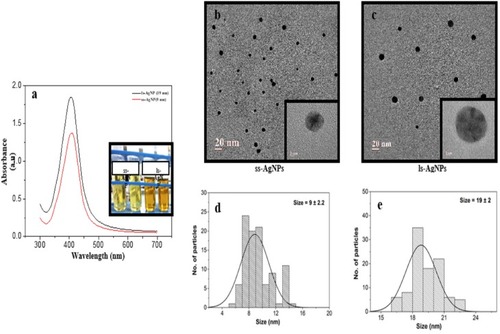
Figure 2 Analysis of internalization of ss-AgNPs and ls-AgNPs. (A) Phase-contrast images of cells after treatment with 25 µM of AgNPs for 24 h. “Ctrl” represents un-treated cells. Scale bar- 100 µm (B) MTT assay analyzing cell viability after 24 h of treatment with AgNPs in MCF-7 cells. [C (i) and (ii)] Fluorescent microscopic images of MCF-7 cells after treatment with IC50 dose of C6 tagged AgNPs for 6 h and 24 h. Scale bar- 200 µm. (D) A comparative fold change between C6 tagged ss-AgNP and ls-AgNp uptake (25 µM) measured through flow cytometry at different time points. (E) A comparative difference in uptake of C6 tagged AgNPs (IC50) at different time points (1 h, 6 h & 24 h) as measured through flow cytometry. The symbol (*) represents a significant difference between different treatments.
![Figure 2 Analysis of internalization of ss-AgNPs and ls-AgNPs. (A) Phase-contrast images of cells after treatment with 25 µM of AgNPs for 24 h. “Ctrl” represents un-treated cells. Scale bar- 100 µm (B) MTT assay analyzing cell viability after 24 h of treatment with AgNPs in MCF-7 cells. [C (i) and (ii)] Fluorescent microscopic images of MCF-7 cells after treatment with IC50 dose of C6 tagged AgNPs for 6 h and 24 h. Scale bar- 200 µm. (D) A comparative fold change between C6 tagged ss-AgNP and ls-AgNp uptake (25 µM) measured through flow cytometry at different time points. (E) A comparative difference in uptake of C6 tagged AgNPs (IC50) at different time points (1 h, 6 h & 24 h) as measured through flow cytometry. The symbol (*) represents a significant difference between different treatments.](/cms/asset/ffb7deac-fdcc-4bc7-995f-c6b8addfac76/dijn_a_222211_f0002_c.jpg)
Figure 3 Analysis of intra-cellular uptake mechanism of ss-AgNPs and ls-AgNPs. Flow cytometric analysis of the uptake of ss-AgNPs (A) and ls-AgNPs (B) (at IC50 dose) 1 h after treatment with NPs. The cells were exposed for 30 min to the different endocytic pathway inhibitors prior to AgNP exposure. The inhibitors used were- Nocodazole (Noc; 0.5 µM), Genistein (Gen; 10 µM), Chlorpromazine (CPZ; 5 µM) and Dynasore (Dyn; 50 µM). (C) Immunofluorescence images of cells treated with IC50 dose of ss-AgNPs (green) with and without Dyn. Cells were stained with anti-rabbit TR conjugated secondary antibody against clathrin (red). Scale bar- 200 µm. The symbol (*) represents a significant difference with respect to AgNP-treated cells.
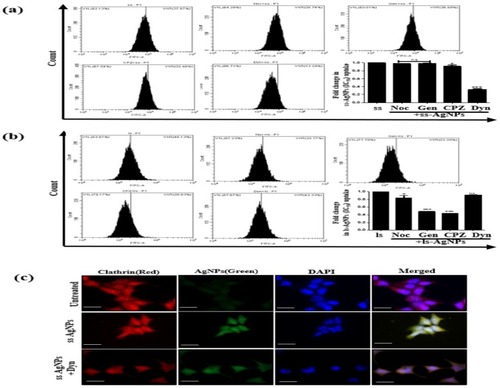
Figure 4 Analysis of early induction of autophagy and JNK after AgNP exposure. (A) Immunoblot showing expression of LC3B-II and p62 after 1 h of treatment with AgNPs. (B) Immunoblot showing expression of LC3B-II, p62 and JNK after treatment with AgNPs for 6 h. (C) Immunoblot showing expression of LC3B-II upon AgNPs treatment for 6 h after inhibiting JNK by SP600125. Wherever mentioned, SP600125 (25 µM) was added 24 h before AgNP treatment. GAPDH served as a loading control. (D) Fluorescent microscopic images showing co-localization of LC3 (red) with lysosomes (Lyso Tracker green) after 6 h of AgNP treatment. Scale bar- 200 µm. [Symbol (*), (#) and ($) represent statistically significant difference with respect to untreated cells, AgNP-treated cells, and AgNP with inhibitor/inducer respectively].
![Figure 4 Analysis of early induction of autophagy and JNK after AgNP exposure. (A) Immunoblot showing expression of LC3B-II and p62 after 1 h of treatment with AgNPs. (B) Immunoblot showing expression of LC3B-II, p62 and JNK after treatment with AgNPs for 6 h. (C) Immunoblot showing expression of LC3B-II upon AgNPs treatment for 6 h after inhibiting JNK by SP600125. Wherever mentioned, SP600125 (25 µM) was added 24 h before AgNP treatment. GAPDH served as a loading control. (D) Fluorescent microscopic images showing co-localization of LC3 (red) with lysosomes (Lyso Tracker green) after 6 h of AgNP treatment. Scale bar- 200 µm. [Symbol (*), (#) and ($) represent statistically significant difference with respect to untreated cells, AgNP-treated cells, and AgNP with inhibitor/inducer respectively].](/cms/asset/08316975-170b-4b59-ac6e-c9e191d91d59/dijn_a_222211_f0004_c.jpg)
Figure 5 Analysis of correlation of JNK and autophagy signaling with NP uptake. (A) Immunoblot showing expression of Rab7 after treatment with IC50 dose of AgNPs for 6 h in presence or absence of CQ. [Symbol *@ and # represent significant difference with respect to untreated cells, CQ-treated cells and CQ plus NP treatment, respectively]. CQ (20 µM) was added 24 h before NP treatment. (B) Flow cytometric analysis of the uptake of AgNPs post inhibition of autophagy and JNK signaling. CQ (20 µM) or SP600125 (25 µM) were added 24 h before NP treatment (C) Flow cytometric analysis of the uptake of AgNPs post treatment with Rapa (500 nM). Rapa was added 24 h before NP treatment [$ represents significant difference with respect to AgNP treatment].
![Figure 5 Analysis of correlation of JNK and autophagy signaling with NP uptake. (A) Immunoblot showing expression of Rab7 after treatment with IC50 dose of AgNPs for 6 h in presence or absence of CQ. [Symbol *@ and # represent significant difference with respect to untreated cells, CQ-treated cells and CQ plus NP treatment, respectively]. CQ (20 µM) was added 24 h before NP treatment. (B) Flow cytometric analysis of the uptake of AgNPs post inhibition of autophagy and JNK signaling. CQ (20 µM) or SP600125 (25 µM) were added 24 h before NP treatment (C) Flow cytometric analysis of the uptake of AgNPs post treatment with Rapa (500 nM). Rapa was added 24 h before NP treatment [$ represents significant difference with respect to AgNP treatment].](/cms/asset/195ccf96-45b1-4a58-afd1-f0894d7671e4/dijn_a_222211_f0005_b.jpg)
Figure 6 Analysis of AgNP accumulation over time on trafficking and autophagic flux. (A) Immunoblots showing expression of LC3B-II and p62 after AgNP exposure for 24 h. (B) Immunoblots showing expression of EEA1 and Rab7 at different time points post exposure to IC50 dose of AgNPs. (C) A comparative analysis of GFP-ub punctae green fluorescence after 6 h and 24 h of AgNP exposure. Scale bar- 200 µm. (D) Immunoblot showing total ubiquitinated protein after exposure to AgNPs. Rapa was added 24 h before NP treatment. [Symbol *#, @ and $ represent statistically significant difference with respect to untreated cells, AgNP-treated, 1 h AgNP treatment & 6/24 h of AgNP treatment respectively].
![Figure 6 Analysis of AgNP accumulation over time on trafficking and autophagic flux. (A) Immunoblots showing expression of LC3B-II and p62 after AgNP exposure for 24 h. (B) Immunoblots showing expression of EEA1 and Rab7 at different time points post exposure to IC50 dose of AgNPs. (C) A comparative analysis of GFP-ub punctae green fluorescence after 6 h and 24 h of AgNP exposure. Scale bar- 200 µm. (D) Immunoblot showing total ubiquitinated protein after exposure to AgNPs. Rapa was added 24 h before NP treatment. [Symbol *#, @ and $ represent statistically significant difference with respect to untreated cells, AgNP-treated, 1 h AgNP treatment & 6/24 h of AgNP treatment respectively].](/cms/asset/3094af7d-fe99-44c7-9e74-6436884a1c38/dijn_a_222211_f0006_b.jpg)
Figure 7 Analysis of prolonged AgNP exposure on lysosomal function. (A) Immunoblot showing comparative LAMP1 expression at different time points post-AgNP exposure. (B) A comparative analysis of LysoTracker Red fluorescence between 6 h and 24 h, post exposure to AgNPs. (C) A comparative analysis of AO red fluorescence at different time points as analyzed through flow cytometer post-exposure to AgNPs. [Significant difference between 6 h and 24 h of AgNP treatment with respect to 1 h is represented as (*), whereas as ($) represents a significant difference between 6 h and 24 h]. (D) A comparative analysis of LysoTracker Red fluorescence with or without Rapa, post exposure to AgNPs at IC50 dose for 24 h. (E) A comparative analysis of AO red fluorescence, in presence or absence of Rapa, post exposure to AgNPs at IC50 dose for 24 h. Rapa was added 24 h before NP treatment. [Symbol @ represents statistically significant difference with respect to AgNP-treated cells]. Scale bar- 200 µm.
![Figure 7 Analysis of prolonged AgNP exposure on lysosomal function. (A) Immunoblot showing comparative LAMP1 expression at different time points post-AgNP exposure. (B) A comparative analysis of LysoTracker Red fluorescence between 6 h and 24 h, post exposure to AgNPs. (C) A comparative analysis of AO red fluorescence at different time points as analyzed through flow cytometer post-exposure to AgNPs. [Significant difference between 6 h and 24 h of AgNP treatment with respect to 1 h is represented as (*), whereas as ($) represents a significant difference between 6 h and 24 h]. (D) A comparative analysis of LysoTracker Red fluorescence with or without Rapa, post exposure to AgNPs at IC50 dose for 24 h. (E) A comparative analysis of AO red fluorescence, in presence or absence of Rapa, post exposure to AgNPs at IC50 dose for 24 h. Rapa was added 24 h before NP treatment. [Symbol @ represents statistically significant difference with respect to AgNP-treated cells]. Scale bar- 200 µm.](/cms/asset/a0d9f52d-febf-4479-a01b-3f3b3555b65d/dijn_a_222211_f0007_c.jpg)
Figure 8 Analysis of autophagy mediated intra-cellular ROS and cytotoxicity. [A(i)] Fold change in intracellular ROS levels post-exposure to AgNPs for 6 h & 24 h, (ii) MTT assay analyzing cell viability after 6 h & 24 h of AgNP treatment, in presence or absence of NAC (20 mM). NAC was added 1 h before AgNP treatment. [B(i)] Fold change in intracellular ROS levels post-exposure to AgNPs for 6 h in presence or absence of CQ (20 µM). (ii) MTT assay measuring cell viability post-exposure to AgNPs for 6 h in the presence or absence of CQ. (iii) Immunoblots showing expression of LC3B-II protein after 24 h of AgNP treatment with or without NAC. (iv) AnnexinV/PI staining representing percentage of dead cells post-exposure to IC50 dose of AgNPs for 24 h, with or without silencing of ATG5, as analyzed through flow cytometry. (C) Fold change in intracellular ROS levels and cell viability analysis post-exposure to AgNPs for 24 h, in presence or absence of Rapa. (D) Flow cytometric analysis of MMP with JC-1 dye in cells treated with IC50 dose of AgNPs for 24 h. [E (i)] Dot plots of AnnexinV/PI staining post-exposure to IC50 dose of AgNPs for 24 h and 48 h, respectively, as analyzed through flow cytometry. (ii) Immunoblots showing expression of total PARP after exposure of IC50 dose of AgNPs for 24 h. [Symbol (*) and (#) represent a significant difference in AgNP-treated cells with respect to untreated control and specific inhibitor respectively].
![Figure 8 Analysis of autophagy mediated intra-cellular ROS and cytotoxicity. [A(i)] Fold change in intracellular ROS levels post-exposure to AgNPs for 6 h & 24 h, (ii) MTT assay analyzing cell viability after 6 h & 24 h of AgNP treatment, in presence or absence of NAC (20 mM). NAC was added 1 h before AgNP treatment. [B(i)] Fold change in intracellular ROS levels post-exposure to AgNPs for 6 h in presence or absence of CQ (20 µM). (ii) MTT assay measuring cell viability post-exposure to AgNPs for 6 h in the presence or absence of CQ. (iii) Immunoblots showing expression of LC3B-II protein after 24 h of AgNP treatment with or without NAC. (iv) AnnexinV/PI staining representing percentage of dead cells post-exposure to IC50 dose of AgNPs for 24 h, with or without silencing of ATG5, as analyzed through flow cytometry. (C) Fold change in intracellular ROS levels and cell viability analysis post-exposure to AgNPs for 24 h, in presence or absence of Rapa. (D) Flow cytometric analysis of MMP with JC-1 dye in cells treated with IC50 dose of AgNPs for 24 h. [E (i)] Dot plots of AnnexinV/PI staining post-exposure to IC50 dose of AgNPs for 24 h and 48 h, respectively, as analyzed through flow cytometry. (ii) Immunoblots showing expression of total PARP after exposure of IC50 dose of AgNPs for 24 h. [Symbol (*) and (#) represent a significant difference in AgNP-treated cells with respect to untreated control and specific inhibitor respectively].](/cms/asset/75f5d500-82f2-4a27-823e-89645c06978d/dijn_a_222211_f0008_b.jpg)
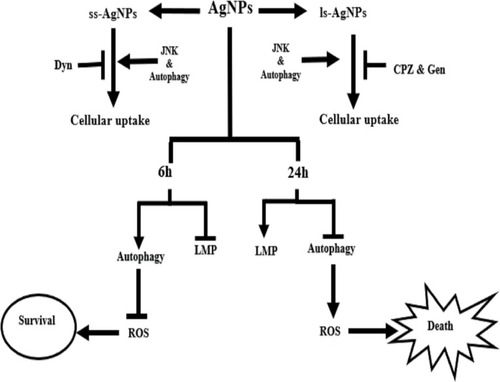
Figure 9 Schematic representation of the crosstalk between AgNP and autophagy.