Figures & data
Figure 1 Characterization of iron oxide nanoparticles. (A) Transmission electron microscope (TEM) images of IONPs depicting the shape and size of nanoparticles. Scale bar size, 20 nm. (B) Crystal lattice image of IONPs; bar size of 1 nm. Analysis was performed at 200 kV.
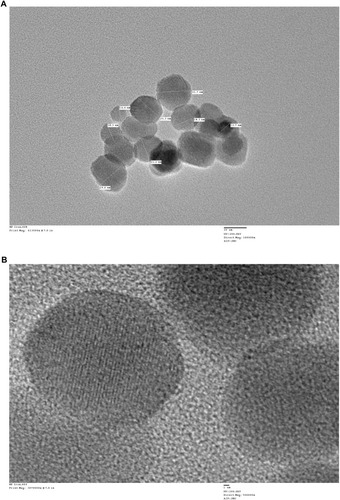
Figure 2 (A) Scanning electron microscopy (SEM) image of iron oxide nanoparticles. (B) Field emission scanning electron microscopy (FE SEM) image of IONPs confirming a spherical shape. (C) Energy-dispersive X-ray profile confirming the elemental composition of IONPs, depicting peaks of iron and oxygen (IONPs in a gold grid). Analysis was conducted at 15 kV.
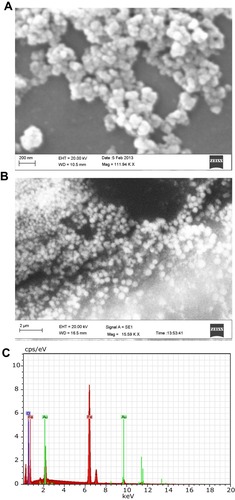
Figure 3 Hydrodynamic diameters measured via dynamic light scattering (DLS) of iron oxide nanoparticles in PBS recorded daily for 7 days. Data in graphs are presented as mean ± standard deviation for nanoparticle samples (n=3). Error bars represent standard deviation.
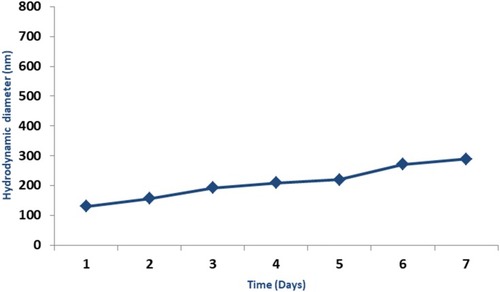
Figure 4 Biocompatibility assessment of IONPs in HeLa cells via MTT assay. Cells were treated with 10, 20, 40, 80 and 100 µg/mL IONPs for 24 hrs. Data in graphs are presented as mean ± standard deviation (n=3). Error bars represent standard deviation. Statistical significance was determined using one-way analysis of variance (ANOVA) and multiple comparisons conducted using Tukey’s test. Inter-group significant differences (p<0.05) are marked by letters: a (vs control), b (vs 10 µg/mL IONPs), c (vs 20 µg/mL IONPs), d (vs 40 µg/mL IONPs), and e (vs 80 µg/mL IONPs).
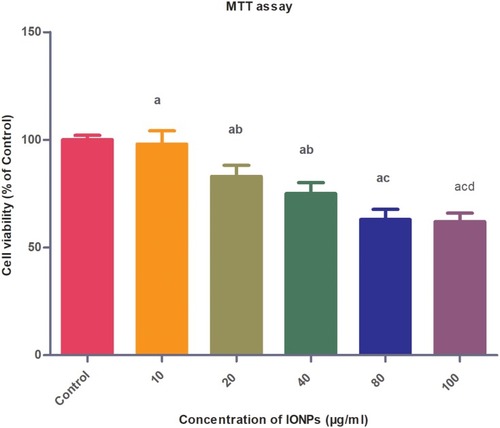
Figure 5 Body weights of Wistar rats following injection of different doses of IONPs or control recorded daily for 28 days. Results are expressed as mean ± SD (n=3). No significant differences were observed among the control and treated groups over the 28-day period.
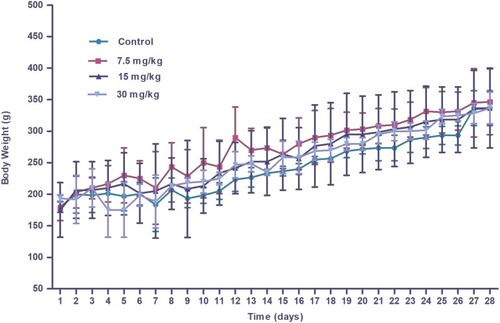
Figure 6 Coefficient of organs (liver, kidney, spleen, heart, lung, testis and brain) of Wistar rats injected with different doses of IONPs relative to control. Coefficient of organs represents the ratio of organ weight (g) to animal body weight (g). Differences between nanoparticle-injected and control groups were not significant.
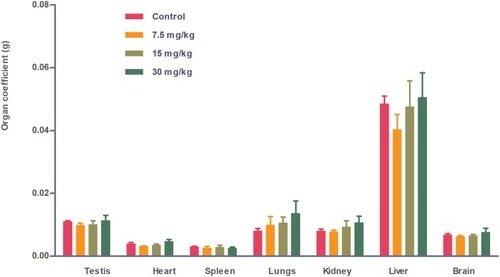
Figure 7 Water intake (mL) of control and experimental Wistar rats administered different doses of IONPs. Differences in intake were significant in the 30 mg/kg nanoparticle-administered group, compared to control, during the initial period after treatment but not in the later stages. Statistical significance was determined using one-way analysis of variance (ANOVA) and multiple comparisons conducted using Tukey’s test. * Statistically significant (p<0.05).
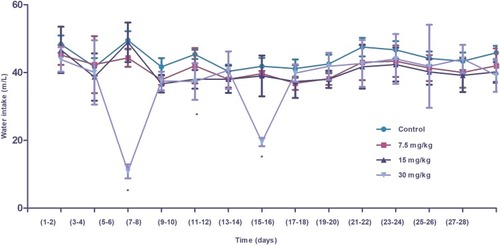
Figure 8 Feed intake (g) of control and experimental Wistar rats administered iron oxide nanoparticles. Significant differences in feed intake were observed only at high doses of nanoparticles (30 mg/kg), compared to the control group. Differences in feed intake in the remaining groups treated with lower doses of IONPs were not statistically significant. Statistical significance was determined using one-way analysis of variance (ANOVA) and multiple comparisons conducted using Tukey’s test. * Statistically significant (p<0.05).
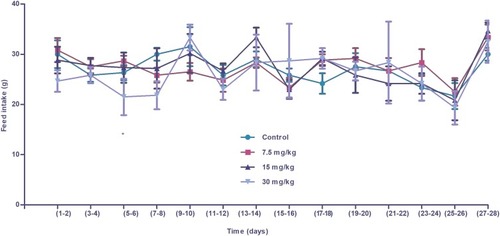
Figure 9 Graph showing iron content excreted through urine of animals injected with different IONPs doses. Daily iron concentration excreted in urine (ng/mL) during the study period (28 days) (A). Box plot depicts the mean iron concentration excreted through urine over 28 days (B). Data are presented as mean ± standard deviation (n=3). Error bars represent standard deviation. Statistical significance was determined using one-way analysis of variance (ANOVA) and multiple comparisons conducted using Tukey’s test. Significant inter-group differences (p<0.05) are marked by letters: a (vs control), b (vs 7.5 mg/kg IONPs), and c (vs 15 mg/kg IONPs).
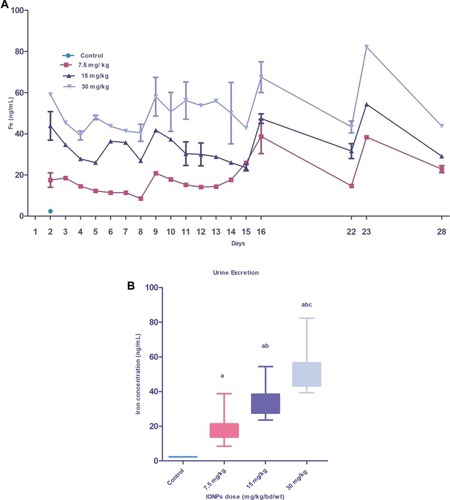
Figure 10 Iron content excreted through feces of animals injected with different doses of IONPs. Iron concentrations in feces (ng/g dry weight) excreted daily during the exposure period (28 days) (A). Box plot depicts mean iron concentrations excreted through feces over 28 days (B). Data represent mean ± standard deviation of nanoparticle concentrations in feces (n=3). Error bars denote standard deviation. Statistical significance was determined using one-way analysis of variance (ANOVA) and multiple comparisons conducted using Tukey’s test. Significant inter-group differences (p<0.05) are marked by letters: a (vs control), b (vs 7.5 mg/kg IONPs), and c (vs 15 mg/kg IONPs).
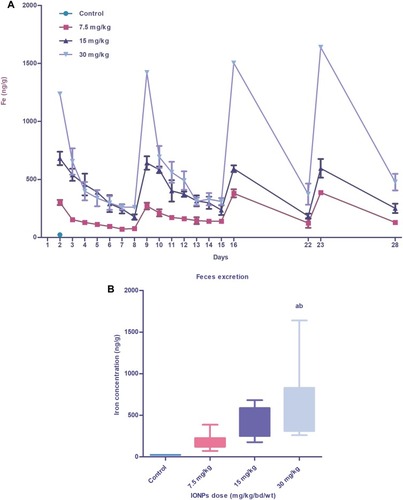
Figure 11 Bioaccumulation patterns of IONPs in different organs of Wistar rat, specifically, spleen (A), blood (B), liver (C), kidney (D), lungs (E), heart (F) brain (G) and testis (H) treated with varying doses of IONPs. Statistically significant (p<0.05) accumulation of IONPs was observed in a dose-dependent manner in the organs examined, except testis and brain, where significant distribution was evident only in the high-dose (30 mg/kg) group. Results are presented as mean ± standard deviation (n=6). Error bars represent standard deviation. Statistical significance was determined using one-way analysis of variance (ANOVA) and multiple comparisons conducted using Tukey’s test. Significant inter-group differences (p<0.05) are marked by letters: a (vs control), b (vs 7.5 mg/kg IONPs), and c (vs 15 mg/kg IONPs).
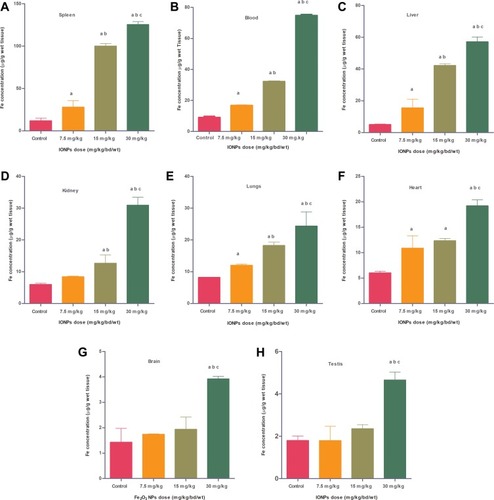
Figure 12 Transmission electron microscopy (TEM) images of different organs (A and B of liver, C and D of Kidney) of Wistar rats injected with different doses of IONPs and control. Liver ultrastructure shows nanoparticles (red arrows), fat globules (F), nucleus (N), mitochondria (M), rough endoplasmic reticulum (RER), glycogen granules (G), vesicles (V). (A) Control and (B) 30 mg/kg-treated group's liver image. (C) Control and (D) 30 mg/kg-treated group's kidney, vacuolization in cytoplasm (white arrows), damaged mitochondria (black circle), lysosomes (red arrows), mitochondria (M), and nucleus (N).
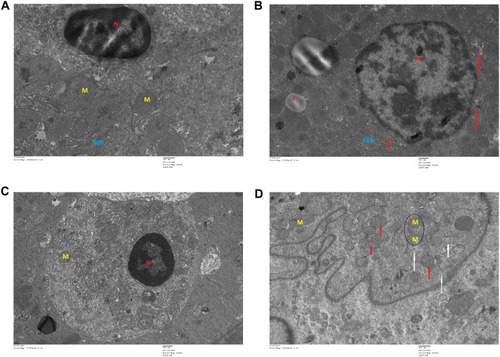
Figure 13 Transmission electron microscopy (TEM) images of different organs (E and F of spleen, and C and D of testis) of Wistar rats treated with IONPs and control. (A) Control and (B) 30 mg/kg-treated group's Spleen ultrastructure shows, vacuolization in cytoplasm (white arrows), nanoparticles (black circles). (C) Control and (D) 30 mg/kg-treated group's ultrastructure of testis-treated group shows degenerated and highly vacuolated cytoplasm (red arrows).
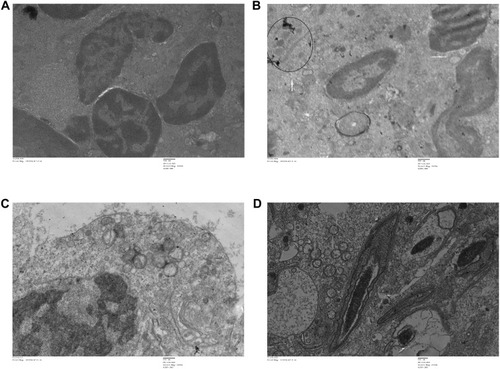
Figure 14 Transmission electron microscopy (TEM) images of different organs (A and B of Heart and C and D of lung) of Wistar rats treated with IONPs and control. (A) Control and (B) 30 mg/kg-treated group's ultrastructure of heart nucleus (N), mitochondria (M), nanoparticle deposition (white arrow), mitochondrial Cristae vacuolization (red arrow). (C) Control and (D) 30 mg/kg-treated group's ultrastructure of lung nucleus (N), mitochondria (M), nanoparticle deposition (white arrows), mitochondrial Cristae vacuolization (red arrows).
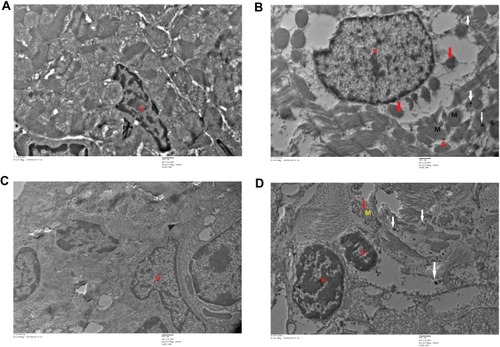
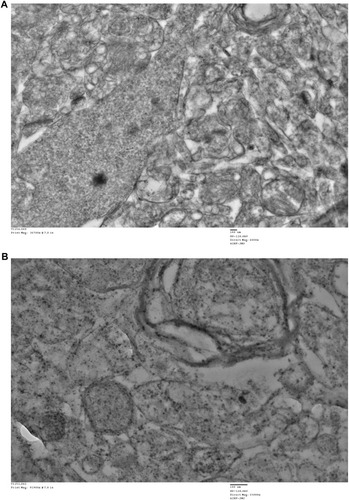
Figure 15 Transmission electron microscopy (TEM) images of brain tissue of Wistar rats injected with a high dose of IONPs (30 mg/kg) and control. Control group shows intact cellular organelles (A), 30 mg/kg treated group’s image showing disintegrated cellular organelles (B).