Figures & data
Figure 1 Tyrosine fluorescence signals of α-syn with or without vitamin K1 in the presence of SWCNTs.
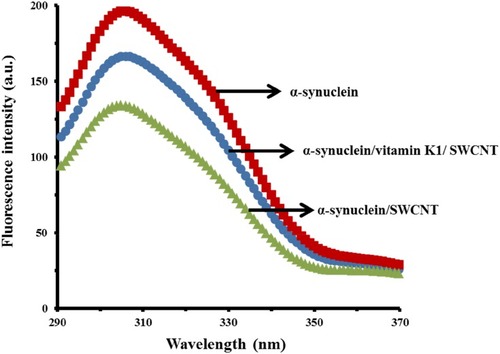
Figure 2 ThT fluorescence signal of α-syn with or vitamin K1 in the presence of SWCNTs.
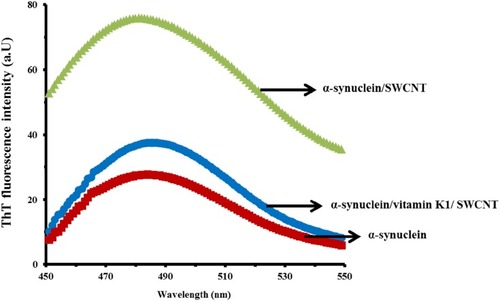
Figure 3 Congo red absorption band of α-syn with or vitamin K1 in the presence of SWCNTs.

Figure 4 CD signals of α-syn with or vitamin K1 in the presence of SWCNTs.
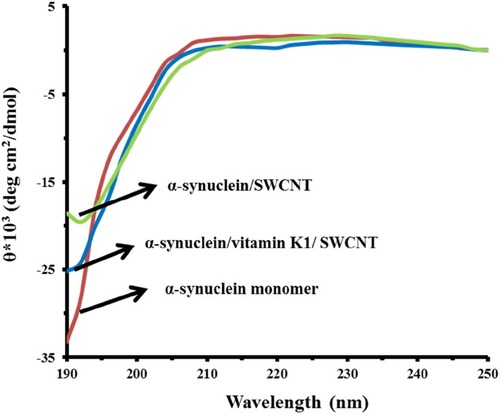
Figure 5 TEM images of SWCNT (A) α-syn/SWCNT (B) and α-syn/vitamin K1/SWCNT (C).
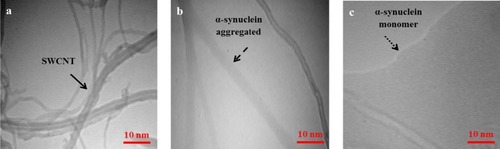
Figure 6 Binding mode of SWCNT to α-syn in the absence (A) and the presence of vitamin K (B).
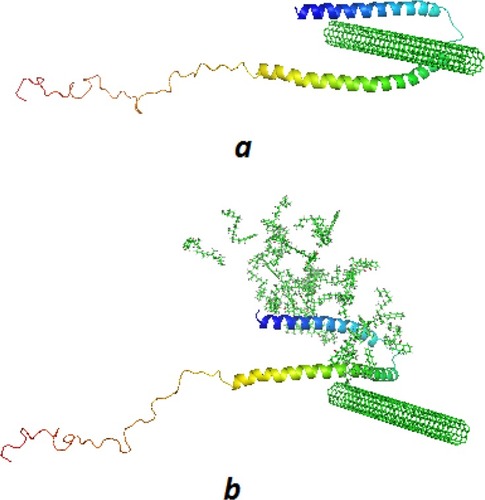
Figure 7 α-syn residues surrounding SWCNT in the absence (A) and presence of vitamin K1 (B) are displayed with numbers within 4 Å.
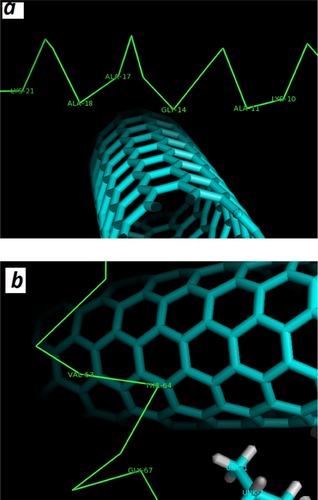
Figure 8 The structure of α-syn/SWCNT in the initial (A), α-syn/SWCNT/vitamin K1 in the initial (B), α-syn/SWCNT after 500 ps evolution (C), and α-syn/SWCNT/vitamin K1 after 500 ps evolution (D).
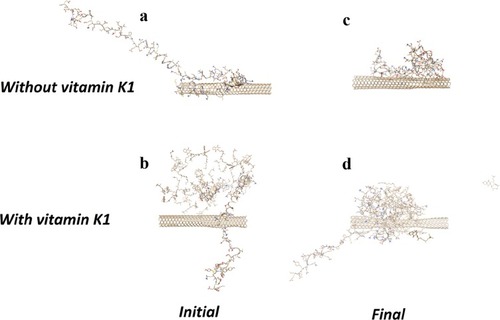
Figure 9 SH-SY5Y cell viability after being exposed to aliquots of α-syn (5 µM), SWCNT (1µgml−1), α-syn/SWCNT complex formed in the absence and presence of vitamin K1. *P ≤ 0.05 statistically different from the control group, #P ≤ 0.05 statistically different from the α-syn/SWCNT complex group.
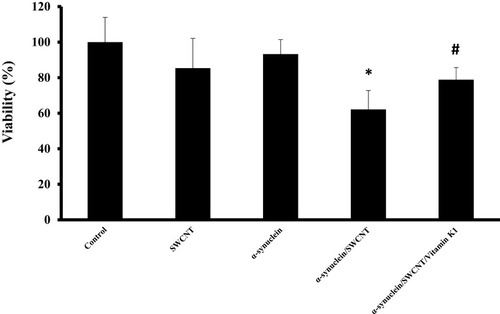
Figure 10 SH-SY5Y cell LDH release after being exposed to aliquots of α-syn (5 µM), SWCNT (1 µg mL−1), α-syn/SWCNT complex formed in the absence and presence of vitamin K1. *P ≤ 0.05 statistically different from the control group, #P ≤ 0.05 statistically different from the α-syn/SWCNT complex group.
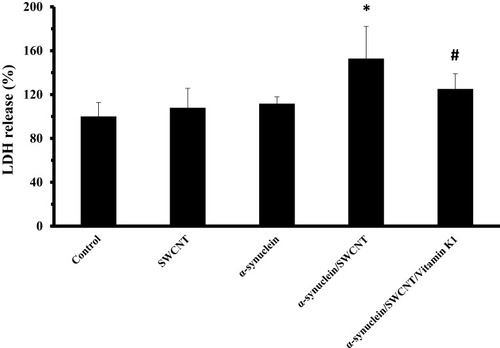
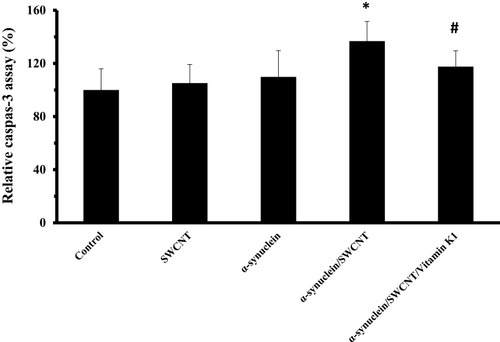
Figure 11 SH-SY5Y cell caspase-3 assay after being exposed to aliquots of α-syn (5 µM), SWCNT (1 µg mL−1), α-syn/SWCNT complex formed in the absence and presence of vitamin K1. *P ≤ 0.05 statistically different from the control group, #P ≤ 0.05 statistically different from the α-syn/SWCNT complex group.