Figures & data
Table 1 Physicochemical properties of nanoemulsions and complexes
Figure 1 Transmission electron micrographs of the complexes formed between nanoemulsions/DNA phosphatidylcholine (A), phosphatidylcholine/stearylamine (B), and 1,2-distearoyl-sn-glycero-3-phosphocholine/stearylamine (C) in the charge ratio of 2.0. 100,000× magnification.
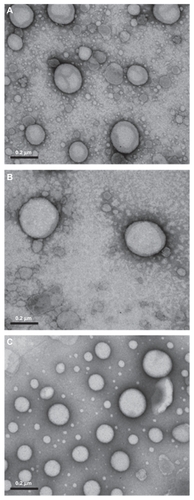
Figure 2 Migration of complexes formed between nanoemulsions/DNA plasmid phosphatidylcholine (A), phosphatidylcholine/stearylamine (B), 1,2-distearoyl-sn-glycero-3-phosphocholine/stearylamine (C), 1,2-dioleoyl-sn-glycero-3-phosphocholine/stearylamine (D), 1,2-distearoyl-sn-glycero-3-phosphoethanolamine/stearylamine (E), and 1,2-dioleoyl-sn-glycero-3-phosphoethanolamine/stearylamine (F) in 1% agarose gel. M = 1 Kb DNA ladder; DNA plasmid = 0.1, 0.5, 1.0, 2.0, and 3.0 charge ratio of cationic nanoemulsions/DNA plasmid.
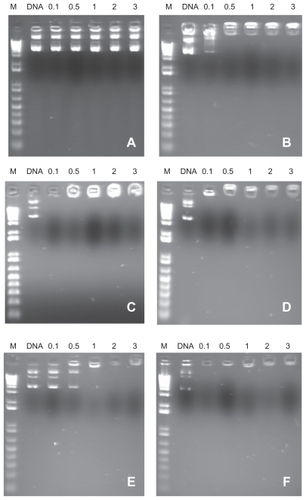
Figure 3 Migration of complexes formed between nanoemulsions/DNA plasmid phosphatidylcholine (A), phosphatidylcholine/stearylamine (B), 1,2-distearoyl-sn-glycero-3-phosphocholine/stearylamine (C), 1,2-dioleoyl-sn-glycero-3-phosphocholine/stearylamine (D), 1,2-distearoyl-sn-glycero-3-phosphoethanolamine/stearylamine (E), and 1,2-dioleoyl-sn-glycero-3-phosphoethanolamine/stearylamine (F) in 1% agarose gel, after 30 minutes of incubation with DNase I. M = 1 Kb DNA ladder; DNA plasmid (a) = naked DNA plasmid, (b) = DNA plasmid + DNase I 0.1, 0.5, 1.0, 2.0, and 3.0 charge ratio of cationic nanoemulsions/DNA plasmid.
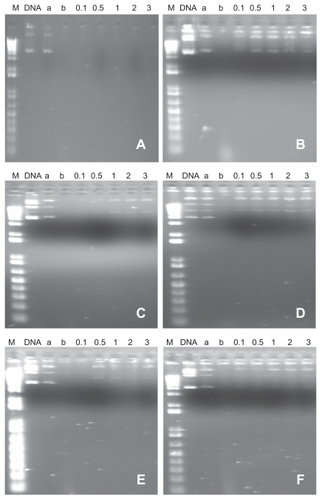
Figure 4 Viability of Hep G2 cells after incubation during 24 hours with nanoemulsions of phosphatidylcholine (⋄), phosphatidylcholine/stearylamine (○), 1,2-distearoyl-sn-glycero-3-phosphocholine/stearylamine (▵), 1,2-dioleoyl-sn-glycero-3-phosphocholine/stearylamine (▴), 1,2-distearoyl-sn-glycero-3-phosphoethanolamine/stearylamine (□) and 1,2-dioleoyl-sn-glycero-3-phosphoethanolamine/stearylamine (■) complexed with DNA plasmid at different charge ratios.
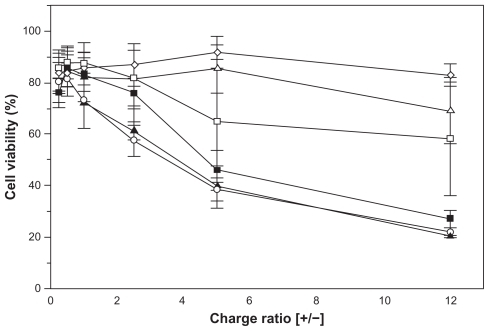
Table 2 Quantification of GFP DNA detected in the transfection assay of Hep G2 cells with the cationic nanoemulsions/pDNA complexes at charge ratio of [+/−] = 2.0 by real-time PCR