Figures & data

Scheme 1 Reaction equation for the hydroxylaminolysis of castor oil.
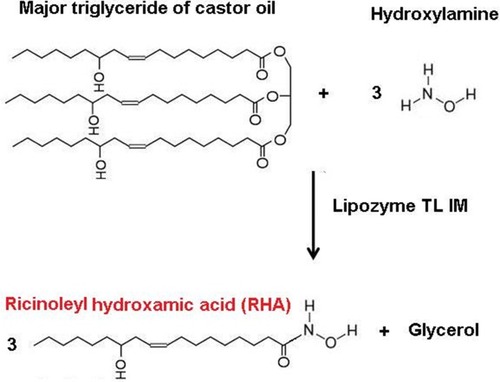
Table 1 Effect of Organic Solvents on the Hydroxylaminolysis of Castor Oil
Figure 1 Effect of reaction time on the hydroxylaminolysis of castor oil. Reaction conditions: hexane = 30 mL, H2O = 20 mL, NaOH (6M) = 2.4 mL, initial pH = 7.0, Lipozyme TL IM = 90 mg, NH2OH·HCl = 1.0 g, castor oil = 2.79 g (3 mmol), temperature = 37°C and shaking rate = 120 rpm.
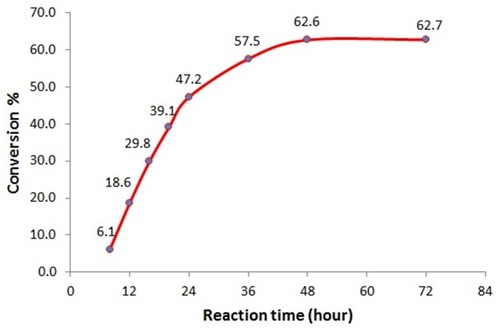
Figure 2 Effect of the amount of the enzyme on the hydroxylaminolysis of castor oil. Reaction conditions: hexane = 30 mL, H2O = 20 mL, NaOH (6M) = 2.4 mL, initial pH = 7.0, reaction time = 48 hours, NH2OH·HCl = 1.0 g, castor oil = 2.79 g (3 mmol), temperature = 37°C and shaking rate = 120 rpm.
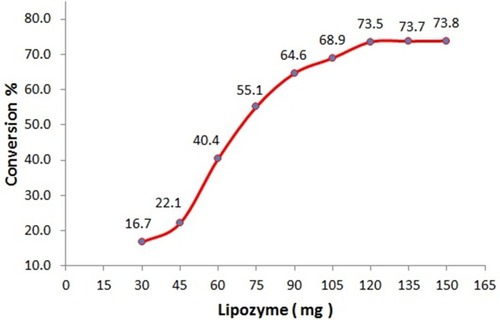
Figure 3 Effect of the molar ratio of HA to oil on the hydroxylaminolysis of castor oil. Reaction conditions: hexane = 30 mL, H2O = 20 mL, initial pH = 7.0, reaction time = 48 hours, Lipozyme TL IM = 120 mg, castor oil = 2.79 g (3 mmol), temperature = 37°C and shaking rate = 120 rpm.
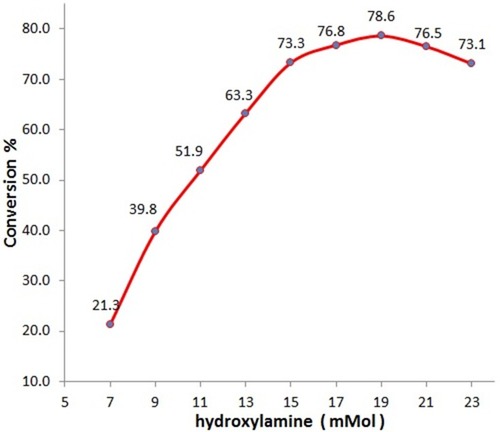
Figure 4 Effects of temperature on the hydroxylaminolysis of castor oil. Reaction conditions: hexane = 30 mL, H2O = 20 mL, NaOH (6M) = 3.15 mL, initial pH = 7.0, reaction time = 48 hours, Lipozyme TL IM = 120 mg, NH2OH·HCl = 19 mmol, castor oil = 2.79 g (3 mmol) and shaking rate = 120 rpm.
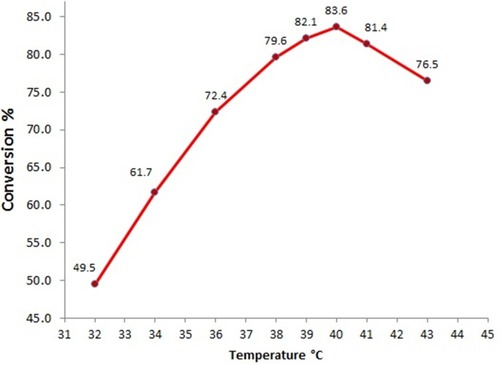
Figure 5 FTIR spectra of castor oil and RHA.

Figure 6 1H-NMR spectra and formula of RHA (hydrogen atoms are labelled by a, b, c, m).
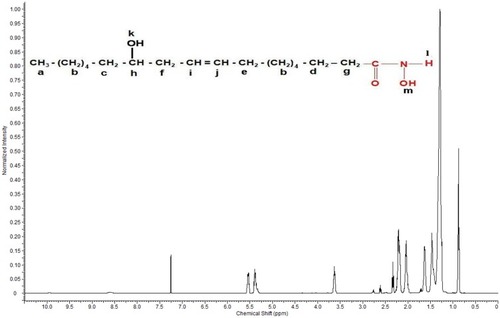
Figure 7 Cytotoxicity of RHA. (A) Representative live/dead images of HDF, melanoma, and glioblastoma cells at 1 and 5 days post-incubation. The green color represents live cells and red color represents dead cells. (B) HDF cell numbers in the presence of different concentrations of RHA at 1, 3, and 5 days post-treatment. (C) Melanoma cell numbers in the presence of different concentrations of RHA at 1, 3, and 5 days post-treatment. (D) Glioblastoma cell numbers in the presence of different concentrations of RHA at 1, 3, and 5 days post-treatment. Data are presented as the mean ± SD (n=6 and ****p < 0.0001).
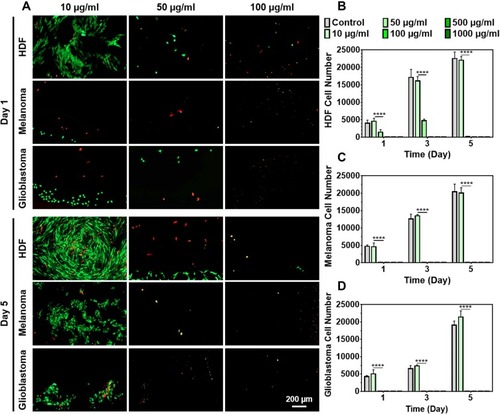
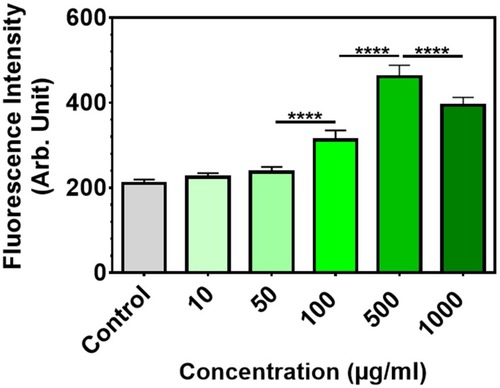
Figure 8 ROS generation of melanoma cells in the presence of various concentrations of RHA at 5 h post-treatment. Data are presented as mean ± SD (n=3 and ****p < 0.0001).