Figures & data
Figure 1 Visual observation of crude quercetin in water (A) and quercetin-loaded nanoparticle suspension (B).
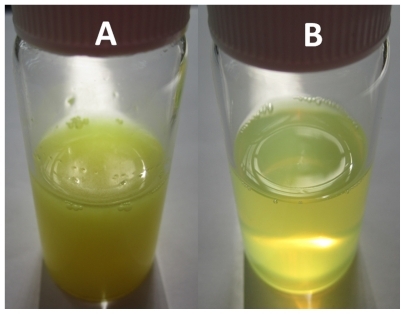
Table 1 Influence of the concentration of TPGS on entrapment efficiency and drug-loading of nanoparticles
Figure 2 Molecular structure of quercetin.
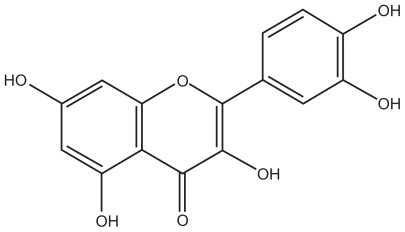
Figure 3 Schematic illustration of possible packing of quercetin-loaded nanoparticles.
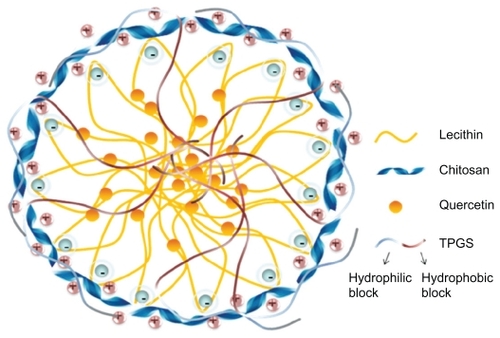
Figure 4 Transmission electron microscopic photograph of quercetin-loaded nanoparticles (10,000×).
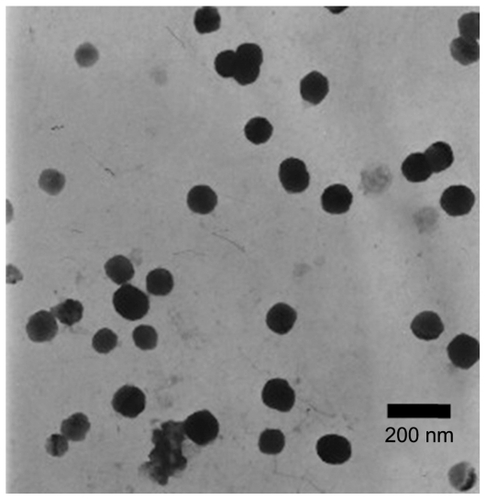
Figure 5 Time course of in vitro skin permeation of quercetin incorporated into nanoparticles or control formulation.
Note: Results are represented by means ± standard deviation (n = 3).
Abbreviations: CG, control group; EG, experimental group.
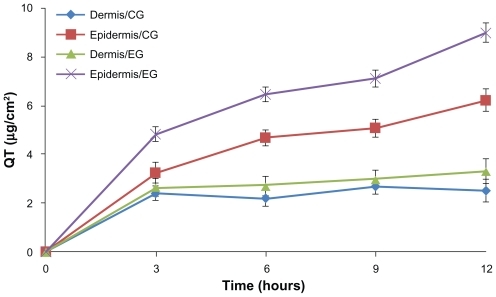
Figure 6 Amount of quercetin in the (A) dermis and (B) epidermis after hours 3, 6, 9, and 12, respectively.
Note: Results are represented by means ± standard deviation (n = 3).
Abbreviations: CG, control group; EG, experimental group.
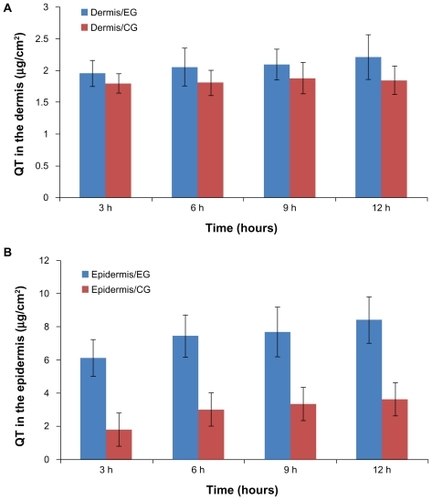
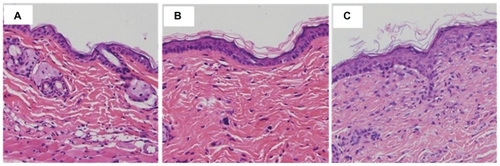
Figure 7 Microphotograph (200×) of vertical section of mouse skin after hematoxylin eosin staining: (A) untreated skin, (B) skin treated with quercetin propylene glycol solution, and (C) skin treated with quercetin-loaded NPs.