Figures & data
Figure 1 Characterization of AgNPs, PNPs and AsNPs.
Notes: (A) Schematic diagram depicting the synthesis of AsNPs. (B) The typical TEM image and (C) corresponding size distribution histogram of AgNPs. The size distribution histogram was obtained by size analysis of over 200 particles. The mean diameter was 18 ± 2 nm. Scale bar: 50 nm. (D) UV-vis spectra and (E) FTIR spectra of AgNPs, PNPs and AsNPs.
Abbreviations: AgNPs, silver nanoparticles; PNPs, PEGylated silver nanoparticles; AsNPs, PEG- and As1411-functionalized silver nanoparticles; TEM, transmission electron microscopy; nm, nanometer; UV-vis, ultraviolet-visible; FTIR, Fourier transform infrared spectroscopy.
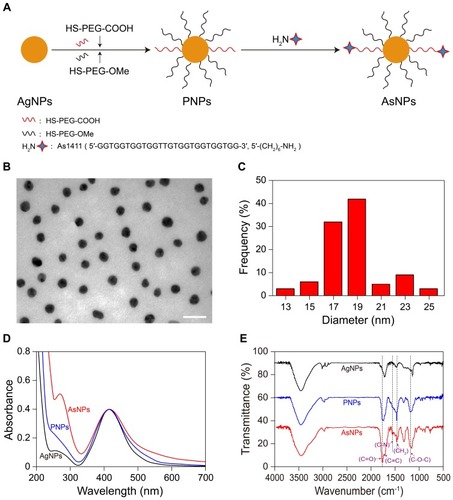
Table 1 Hydrodynamic Sizes, Polydispersity Indexes and Zeta Potentials of AgNPs, PNPs and AsNPs
Figure 2 Effects of AgNPs, PNPs and AsNPs on C6 cell viability with or without irradiation.
Notes: C6 cells were incubated with different concentrations of AgNPs, PNPs or AsNPs for 24 h. Twenty-four hours after 4 Gy X-ray irradiation treatment, cell viability was evaluated by MTT assay. Data are shown as the mean ± SD (n = 3). IR in the figure is an abbreviation for irradiation. **P<0.01, ***P<0.001 compared with the corresponding AgNPs treated group; #P<0.05, ##P<0.01, ###P<0.001 compared with the corresponding PNPs treated group.
Abbreviations: AgNPs, silver nanoparticles; PNPs, PEGylated silver nanoparticles; AsNPs, PEG- and As1411-functionalized silver nanoparticles; h, hours; Gy, gray; MTT, 3-[4,5-dimethylthiazol-2-yl]-2,5-diphenyltetrazolium bromide; SD, standard deviation; n, number.
![Figure 2 Effects of AgNPs, PNPs and AsNPs on C6 cell viability with or without irradiation.Notes: C6 cells were incubated with different concentrations of AgNPs, PNPs or AsNPs for 24 h. Twenty-four hours after 4 Gy X-ray irradiation treatment, cell viability was evaluated by MTT assay. Data are shown as the mean ± SD (n = 3). IR in the figure is an abbreviation for irradiation. **P<0.01, ***P<0.001 compared with the corresponding AgNPs treated group; #P<0.05, ##P<0.01, ###P<0.001 compared with the corresponding PNPs treated group.Abbreviations: AgNPs, silver nanoparticles; PNPs, PEGylated silver nanoparticles; AsNPs, PEG- and As1411-functionalized silver nanoparticles; h, hours; Gy, gray; MTT, 3-[4,5-dimethylthiazol-2-yl]-2,5-diphenyltetrazolium bromide; SD, standard deviation; n, number.](/cms/asset/12e82ff7-4fe0-4608-bb25-3fe0509c6ffc/dijn_a_12191177_f0002_c.jpg)
Figure 3 Cellular uptake and tumor spheroid penetration of AsNPs.
Notes: (A) Cellular uptake of AgNPs, PNPs and AsNPs as assessed by dark-field imaging. The bright spots represented the nanoparticles, and the amount of intracellular AsNPs significantly increased with incubation time and reached the peak at 12 h incubation time. Scale bar: 25 μm. (B) The fluorescence spectra of FITC-PNPs and FITC-AsNPs. (C) The tumor penetration of FITC-PNPs or FITC-AsNPs in a C6 glioma spheroid model. In confocal images, green fluorescence signals indicated FITC-PNPs or FITC-AsNPs. FITC-AsNPs could penetrate into the core of the spheroid at 12 h incubation time while FITC-PNPs were only distributed at the growing edge of tumor spheroid. Scale bar: 100 μm.
Abbreviations: AsNPs, PEG- and As1411-functionalized silver nanoparticles; AgNPs, silver nanoparticles; PNPs, PEGylated silver nanoparticles; h, hours; μm, micrometer; FITC-PNPs, fluorescein isothiocyanate-loaded PEGylated silver nanoparticles; FITC-AsNPs, fluorescein isothiocyanate-loaded PEG- and As1411-functionalized silver nanoparticles.
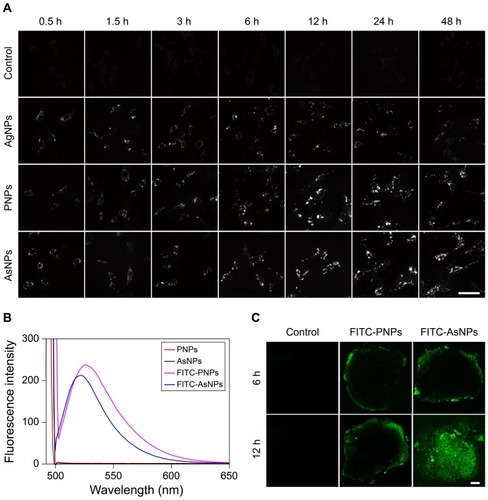
Figure 4 Tumor-targeting property of AsNPs at the cellular level.
Notes: C6 glioma cells and normal human microvascular endothelial cells (HMEC-1) were used in the experiment. (A) Representative dark-field images. Scale bar: 25 μm. (B) Representative confocal images. The cell membranes were stained with DiD (red color), while the cell nuclei were stained with DAPI (blue color). The bright spots represented AsNPs. Scale bar: 25 μm.
Abbreviations: AsNPs, PEG- and As1411-functionalized silver nanoparticles; μm, micrometer; DiD, 1,1′-dioctadecyl-3,3,3′,3′-tetramethylindodicarbocyanine; DAPI, 4′,6-diamidino-2-phenylindole dihydrochloride.
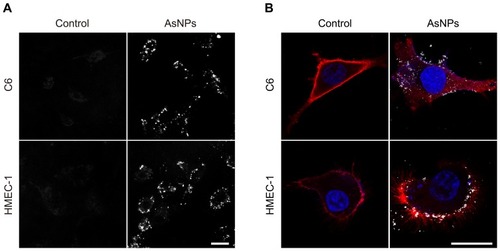
Figure 5 In vivo distribution of AsNPs.
Notes: (A) In vivo images of glioma-bearing nude mice. The mice were injected with Cy5-PNPs or Cy5-AsNPs via the tail vein and imaged at different time intervals. (B) Ex vivo images of the brains. The mice were perfused at 48 h post-injection, and then ex vivo imaging of the brains was performed. (C) The fluorescence intensity ratio of Cy5-AsNPs to that of Cy5-PNPs at the tumor site. Data are shown as the mean ± SD (n = 3).
Abbreviations: AsNPs, PEG- and As1411-functionalized silver nanoparticles; PNPs, PEGylated silver nanoparticles; h, hours; SD, standard deviation; n, number.
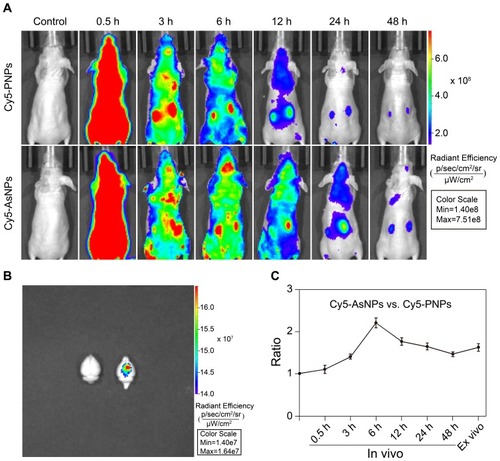
Figure 6 Effects of AgNPs, PNPs and AsNPs plus irradiation on colony formation of C6 cells.
Notes: Data are shown as the mean ± SD (n = 3).
Abbreviations: AgNPs, silver nanoparticles; PNPs, PEGylated silver nanoparticles; AsNPs, PEG- and As1411-functionalized silver nanoparticles; SD, standard deviation; n, number.
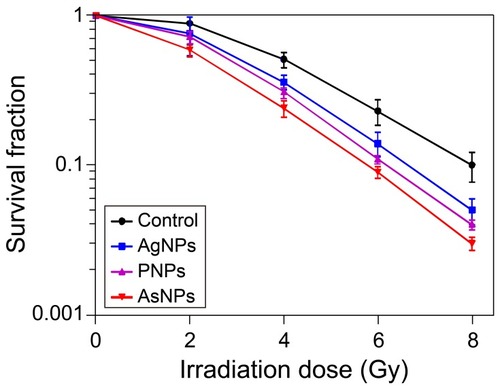
Figure 7 Kaplan-Meier survival curves for C6 glioma-bearing mice following intravenous administration of saline, AgNPs, PNPs or AsNPs with or without irradiation.
Notes: Nine days after tumor implantation, the mice were systemically administered 150 μL saline or nanomaterial solution at a dose of 10 mg/kg (eight mice per group). Six hours after injection, the mice in irradiation groups were irradiated by 6 MV X-ray beams (6 Gy per mouse). IR in the figure is an abbreviation for irradiation.
Abbreviations: AgNPs, silver nanoparticles; PNPs, PEGylated silver nanoparticles; AsNPs, PEG- and As1411-functionalized silver nanoparticles; μL, microliter; mg, milligram; kg, kilogram; MV, megavolt; Gy, gray.
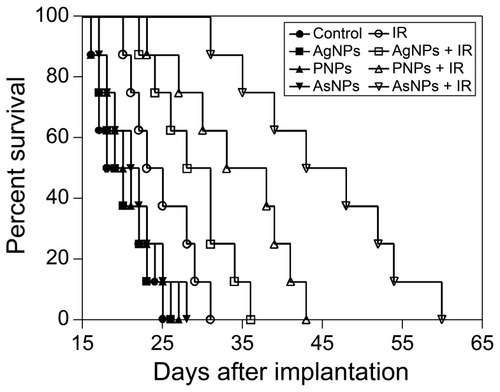
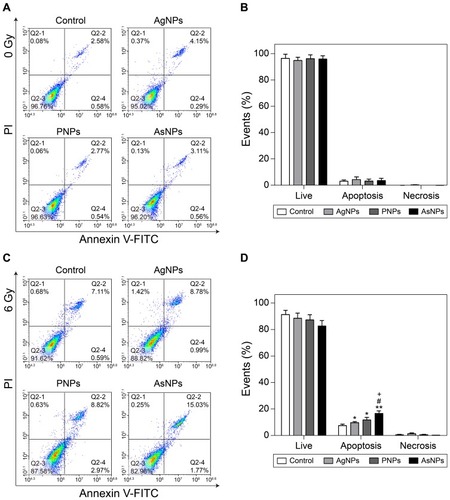
Figure 8 Apoptosis of C6 cells induced by AgNPs, PNPs or AsNPs with or without irradiation.
Notes: Representative flow cytometry images and summary of distributions of cell status without and with irradiation are shown in (A–D), respectively. Data are shown as the mean ± SD (n = 3). *P<0.05, **P<0.01 compared with the irradiation control group; #P<0.05 compared with the AgNPs plus irradiation group; +P<0.05 compared with the PNPs plus irradiation group.
Abbreviations: AgNPs, silver nanoparticles; PNPs, PEGylated silver nanoparticles; AsNPs, PEG- and As1411-functionalized silver nanoparticles; SD, standard deviation; n, number.