Figures & data
Figure 1 Pulmonary ZnONPs exposure caused the pathological changes in mouse liver. (A) After a single treatment of 3, 6, 12 μg/animal ZnONPs via tracheal instillation, H&E staining on liver tissues of mice showed a dose-related manner on pathological changes.(B) The mice were treated with 12 μg/animal ZnONPs via tracheal instillation, the liver tissues were collected at post-exposure day 1, day 3 and day 7. H&E staining was used to observe pathological changes. Scale bar = 200 μm in original figures or 50 μm in Zoom-in figures.
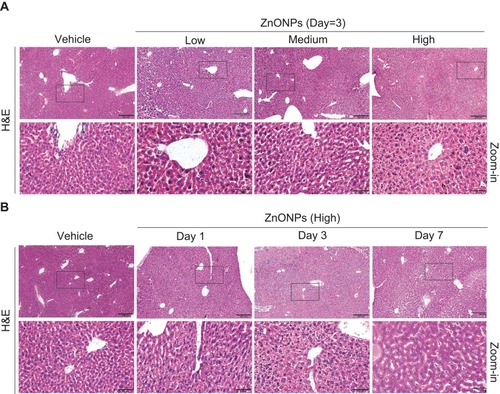
Figure 2 Pulmonary ZnONPs exposure affected the cholesterol biosynthesis in mouse liver. After a single treatment of 3, 6, 12 μg/animal ZnONPs, liver tissues were collected for Western blot assay at post-exposure day 3. (A) Representative Western blot reflecting HMG-CoA protein levels in mouse liver. (B) The protein expression of HMG-CoA obtained from at least three independent experiments. β-actin was served as loading control. (C) Representative images obtained from immunofluorescence reflecting SREBP-2 expression in mouse liver. Scale bar = 50 μm. (D) Fluorescence intensities of SREBP-2 analyzed by Image-Pro Plus image analysis. (E) The total cholesterol in the liver of mouse was determined. Data were derived from at least three independent experiments and were reported as mean ± S.D. “*” denoted P<0.05, compared with the vehicle control.
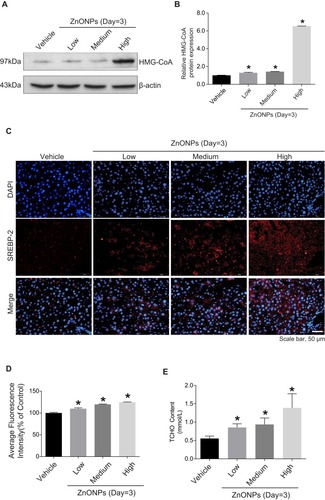
Figure 3 Pulmonary ZnONPs exposure induced autophagy in mouse liver. (A) Representative Western blot reflecting LC3B protein levels in mouse liver. (B) The ratio of LC3B-II/LC3B-I obtained from at least three independent experiments. (C) Representative Western blot reflecting p62 protein levels in mouse liver. (D) Protein expression of p62 obtained from at least three independent experiments. (E) Representative Western blot reflecting Beclin 1 protein levels in mouse liver. (F) Protein expression of Beclin 1 obtained from at least three independent experiments. β-actin and GAPDH were served as loading control, respectively. Data were derived from three independent experiments and were reported as mean ± S.D. “*” denoted P<0.05, compared with the vehicle control.
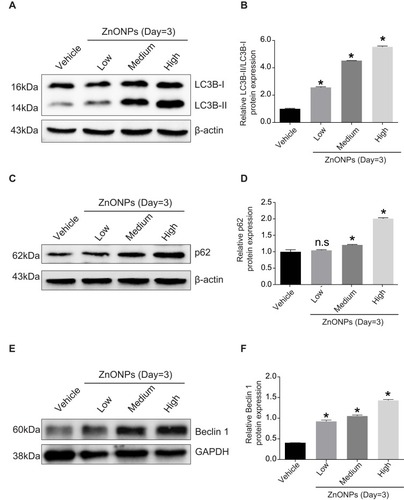
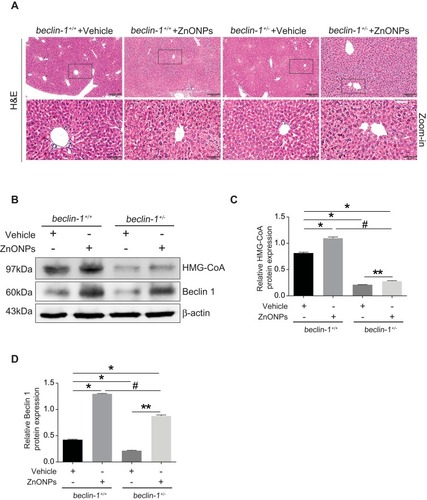
Figure 4 Heterozygous disruption of the beclin 1 alleviated the disturbance of cholesterol biosynthesis and injuries induced by ZnONPs in mouse liver. (A) The beclin 1+/+ and beclin 1+/- mice were treated with 12 μg/animal ZnONPs via tracheal instillation, the liver tissues were collected at post-exposure day 3. H&E staining was used to observe pathological changes. 100 ×, scale bar = 200 μm; 400 ×, scale bar = 50 μm. (B) Representative Western blot reflecting HMG-CoA and Beclin 1 protein levels in beclin 1+/+ and beclin 1+/-mice liver. (C and D) Protein expressions of Beclin 1 and HMG-CoA obtained from at least three independent experiments in beclin 1+/+ and beclin 1+/- mice liver. Data were derived from three independent experiments and were reported as mean ± S.D. “*” denoted P<0.05, compared with the vehicle control in beclin 1+/+ mice. “**” denoted P<0.05, compared with vehicle control in beclin 1+/- mice. “#” denoted P<0.05, compared with ZnONPs-treated beclin 1+/+ mice.