Figures & data
Figure 1 SCBI-based recording device scheme. (A) Scheme of the SCBI-based device. The open platinum recording site (grey) and the gold connecting line wire (orange) are deposited on the silicone substrate (purple) with SCBI technique; the silicone passivation cover is illustrated in light purple. (B) On the left a four channel electrode. The arrow points at the open end of the 4 Pt recording sites. The overall electrode thickness is 0.2 mm. On the right a close-up picture of the recording leads (1×0.5 mm).
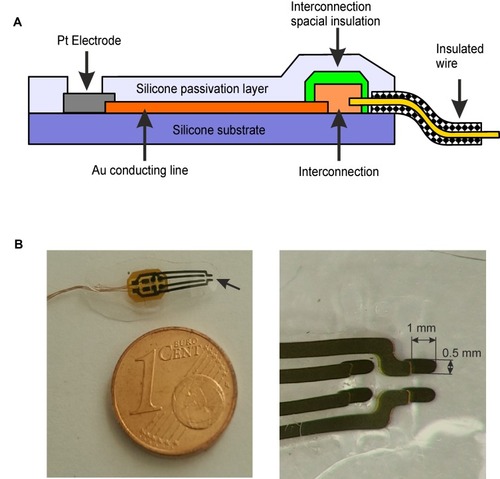
Figure 2 SCBI-based recording device features. (A) Scanning electron microscopy (SEM) image of nanostructured platinum electrode surface obtained with SCBI technique. (B-C) Electrochemical impedance spectroscopy of 4 mm2 nanostructured Pt SCBI (continuous lines) and 4 mm2 bare untreated Pt foil (dashed lines) electrodes. Impedance values (B) and angular phase (C) are illustrated as a function of the frequency. (D) Current-Voltage features of Pt SCBI and Pt foil electrodes measured at 50 mV/s.
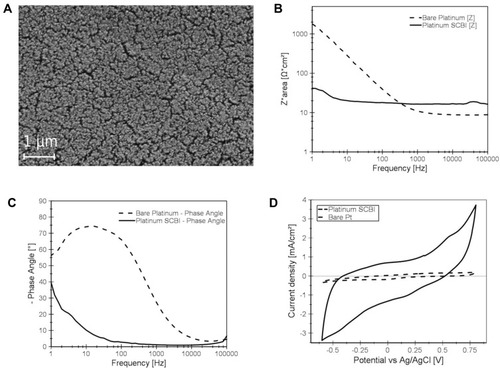
Figure 3 Acute field potential recordings with SCBI-based and standard electrodes. (A) Simultaneous electrophysiological recordings performed with SCBI electrodes (W; red traces), a glass micropipette (P; black traces) and a 16-channel silicon probe (SP; blue traces) in the entorhinal cortex of the in vitro isolated guinea pig brain preparation in response to lateral olfactory tract (LOT) stimulation at 0.1 Hz, 50 µA, 0.1 ms (average of five responses); photograph of the electrode setting in the right panel. Two potentials were recorded with the multichannel SP at the pial surface (light blue, SPs) and at 500 µm depth (dark blue; SPd) in the EC. (B) Loop trace plots of the averaged evoked responses in the upper rows (peak 1*, peak 2**), performed with W, M and P electrodes. (C) The upper part of the panel shows superimposed responses recorded with the three electrode types (color codes as in A) during increasing LOT stimulus intensities. Stimulation current was gradually (10 µA steps) increased from 150 to 1000 µA. Averaged CVC (changes in voltage amplitude in response to increasing current stimulation of the LOT) are illustrated in the lower-left panel. Curves normalized for the difference in amplitude due to the depth position of the electrode are illustrated in the right bottom panel.
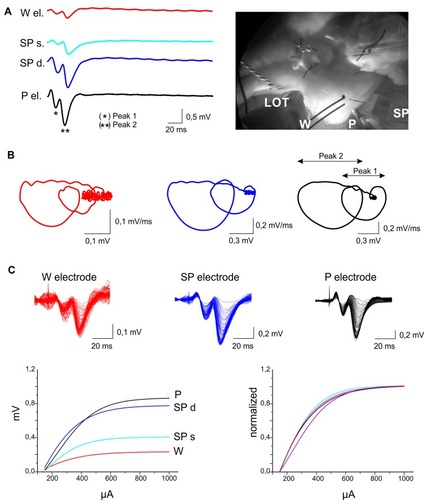
Figure 4 Chronic recordings with implanted epidural SCBI electrodes. (A) Sample recordings performed with E and W electrodes in the same guinea pig, 1 week and 1 month after the electrode implant. (B) Averaged frequency power densities of EEG signals recorded with standard E electrodes (black columns) and with SCBI probes (red columns), 1 week and 1 month after surgical electrode implant. Different frequency bands were separately analyzed (4–8 Hz, 8–13 Hz, 13–30 Hz and 30–50 Hz) in 9 W and 7 E (control) electrodes.
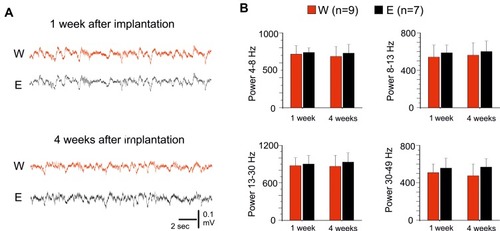
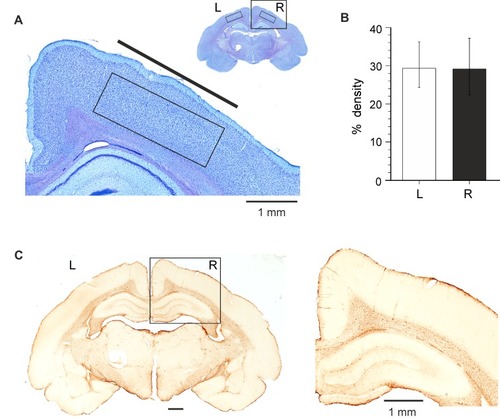
Figure 5 Neuropathological analysis of brain tissue 2 months after implantation of SCBI electrodes in the epidural space over the fronto-parietal cortex of the left hemisphere. (A) Thionine-stained sample coronal section of an electrode-implanted guinea pig brain. The boxes outline the areas utilized to perform quantitative densitometric measurements. The cortical area included in the box of the inset is illustrated at higher magnification. (B) Average data obtained by densitometric measurements (% staining density) performed on the right and left frontoparietal cortical areas (two slices per animal) in six guinea pigs chronically implanted with SCBI electrodes. (C) GFAP-stained section of a coronal section of the brain of a guinea pig implanted with SCBI electrode over the left frontoparietal cortex (and a metal epidural electrode on the right hemisphere); the boxed area is magnified on the right.