Figures & data
Figure 1 Schematic illustration of the methodology used for the synthesis of the C16-HyA-Cy5.5 conjugates. (A) Ion exchange using tetrabutylammonium fluoride (TBA-F) (B) Grafting of hexadecylamine (C16) to the HyA backbone using EDC/NHS (C) Grafting of Cy5.5 hydrazide fluorophore in H2O by the formation of stable amide bonds.
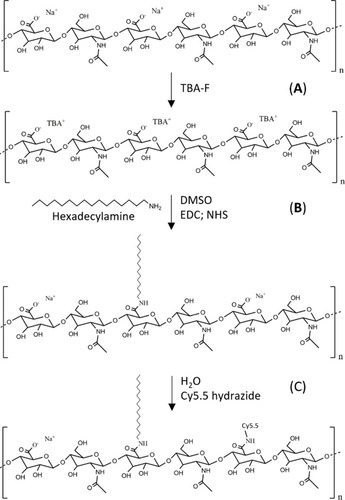
Figure 2 (A) Fluorescence emission spectra (λex=650 nm) of the C16-HyA-Cy5.5 conjugates before and after filtration through 10 kDa MWCO Amicon Ultra-15 centrifugal filters. The top-right rectangle shows the emission spectrum of the filtrate. (B) Average size and polydispersity index (PdI) of the C16-Hya and C16-HyA-Cy5.5 nanogels measured by dynamic light scattering before and after storage for 48 days at 4 °C. Values show Mean ± SD (N=6; *p < 0.05 with p-values obtained using the Student’s t-test for independent samples).
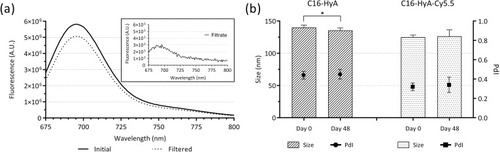
Figure 3 Effect of the C16-HyA-Cy5.5 nanogels on the viability of Caco-2 cells after incubation for 24 and 48 hrs at the concentration of 0.01, 0.05 and 0.1 mg∙mL-1. The cell viability was determined indirectly by measuring fluorescence using the resazurin reduction assay (λex=560 nm, λem=590). DMSO and PBS were used as positive and negative (100% cell viability) controls, respectively. Values show Mean ± SD (N=8 from 2 independent assays; ***p < 0.001 with p-values obtained using the Student’s t-test for independent samples).
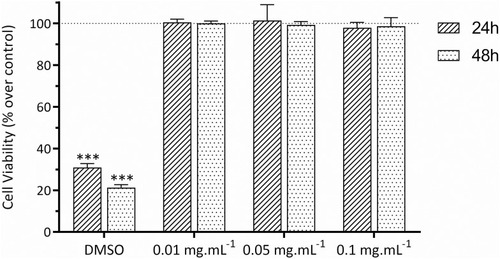
Figure 4 Optical microscopy images of single cultures of Caco-2, HT-29 and HT29-MTX, and co-cultures of Caco-2/HT-29 and Caco-2/HT29-MTX after 21 days of culture in Ibidi 8-well chamber µ-slides. The cells were stained with alcian blue to show the presence of mucus (black arrows). Scale bar: 20 µm.
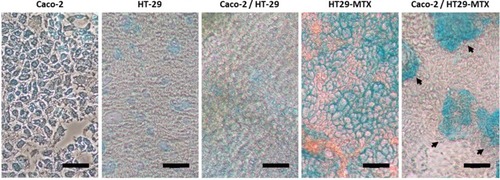
Figure 5 Laser scanning confocal microscopy images of F-actin (green) and nuclei (DAPI, blue) of Caco-2, HT-29 and HT29-MTX monocultures and co-cultures of Caco-2/HT-29 and Caco-2/HT29-MTX.
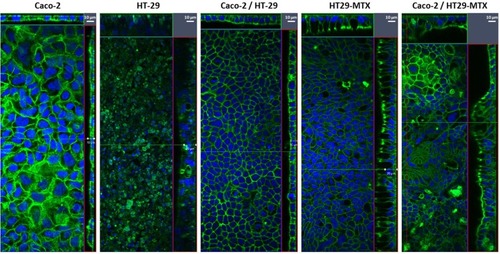
Figure 6 Laser scanning confocal microscopy images of f-actin (red), occludin (green) and nuclei (DAPI, blue) of a single culture of Caco-2 cells and Caco-2/HT-29 MTX co-culture. The images show the staggering difference in the topography of both culture conditions. The formation of a tighter barrier in the Caco-2 monolayer is evidenced by the homogeneous distribution of the tight-junction protein occludin.
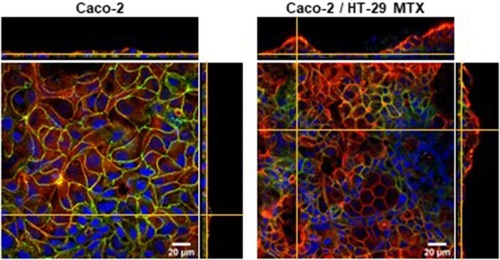
Figure 7 Laser scanning confocal microscopy images of f-actin (green), C16-HyA-Cy5.5 nanogels (red) and nuclei (DAPI, blue) of single cultures of Caco-2 and HT-29 and a Caco-2/HT-29 MTX co-culture. In the bottom images, the actin staining was omitted for clarity.
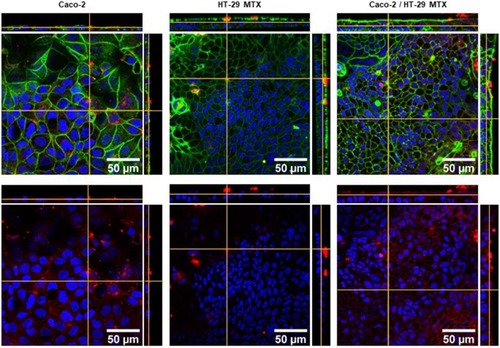
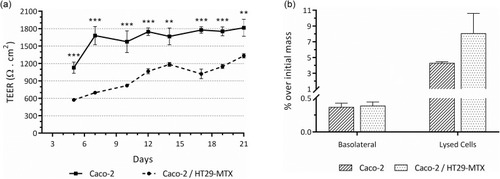
Figure 8 (A) Trans-epithelial electrical resistance (TEER) of single cultures of Caco-2 and co-cultures of Caco-2/HT29-MTX grown for 21 days on the apical chamber of 1-µm pore size transwell® inserts. Values show Mean ± SD (N=5; **p < 0.01; ***p < 0.001 with p-values obtained using the Student’s t-test for independent samples). (B) Intestinal permeability of the C16-HyA-Cy5.5 nanogels incubated for 4h with the in vitro intestinal epithelial models of Caco-2 and Caco-2/HT29-MTX co-cultures grown for 21 days on the apical chamber of 1-µm pore size transwell® inserts. Values show the mass percentage of C16-HyA-Cy5.5 nanogels found in the basolateral chamber and on lysed cells over the initial mass added to the apical chamber (Mean ± SD; N=3).