Figures & data
Table 1 Independent (X1–X3) and dependent (Y1–Y4) variables of DPX-Zein-ALA nanoparticles formulations utilized in Box-Behnken design
Table 2 Formulation variables (X1–X3) of DPX-Zein-ALA nanoparticles and their observed responses (Y1–Y4) as suggested by Box-Behnken design
Table 3 Statistical analysis of variance (ANOVA) of the responses (Y1–Y4) results
Figure 1 Standardized Pareto charts showing the significance of X1, X2 and X3 and their combined effects on Y1 (A); Y2 (B); Y3 (C) and Y4 (D).
Abbreviations: X1, percentage of alpha lipoic acid in zein; X2, polyvinyl alcohol % concentration; X3, stirring rate; Y1, particle size (nm); Y2, zeta potential (mV); Y3, initial permeation after 1 h (%); Y4, cumulative permeation after 24 h (%).

Figure 2 3D response surface plots showing the effects of X1, X2 and X3 on the investigated dependent variables Y1 (A and B); Y2 (C); Y3 (D and E) and Y4 (F).
Abbreviations: DPX, dapoxetine; X1, percentage of alpha lipoic acid in Zein; X2, polyvinyl alcohol % concentration; X3, stirring rate; Y1, particle size (nm); Y2, zeta potential (mV); Y3, initial release after 1 h (%); Y4, cumulative release after 24 h (%).
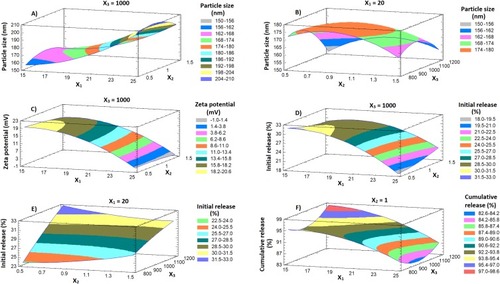
Figure 3 In vitro release profiles of DPX-loaded NPs formulations: (A) F1-F5; (B) F6-F10; and (C) F11-F15.
Abbreviations: DPX, dapoxetine; ALA, alpha lipoic acid.
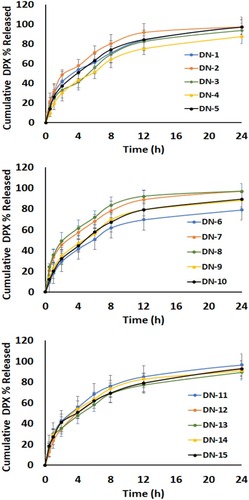
Table 4 Optimal calculated variables and observed, predicted and residual values for responses (Y1–Y4)
Figure 4 Particle size distribution (A), zeta potential (B) measured by particle size analyzer, SEM photomicrographs (C and D) and TEM images (E and F) of optimized DPX-loaded NPs.
Abbreviations: TEM, Transmission electron microscope; DPX, dapoxetine; ALA, alpha lipoic acid.
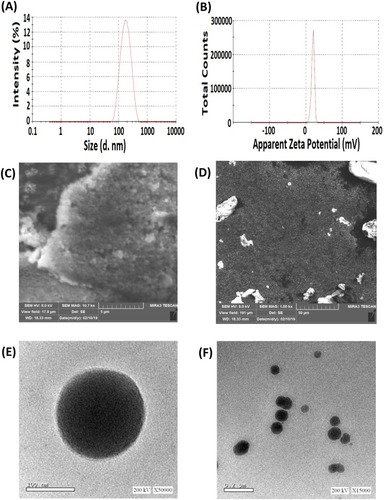
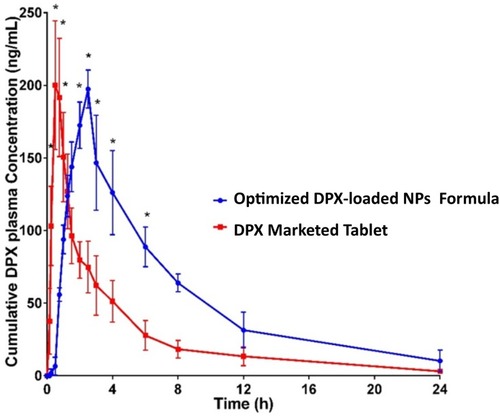
Table 5 Single dose clinical pharmacokinetic parameters after oral administration of 30 mg of optimized DPX-loaded NPs and DPX marketed tablets
Figure 5 Plasma concentration–time profiles for the optimized DPX-zein-ALA nanospheres and marketed DPX tablets (30 mg) administered orally as a single dose. Data represent the mean value ± standard deviation (n=6). *Significant at P<0.05 (two-way ANOVA, Sidak’s multi-comparison test).