Figures & data
Scheme 1 Illustration for the preparation of carrier-free HCPT/Ce6 nanorods by co-assembling HCPT with Ce6 and the application of chemo-photodynamic synergetic antitumor therapy.
Abbreviations: HCPT, 10-hydroxycamptothecine; Ce6, Chlorin e6; NRs, nanorods; ROS, reactive oxygen species; PDT, photodynamic therapy; EPR, enhanced permeability and retention.
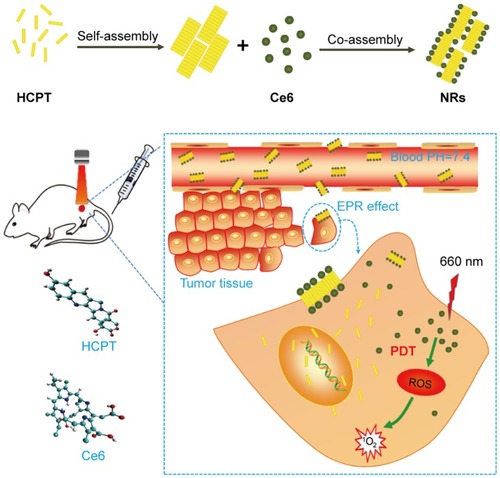
Table 1 The Thermodynamic Parameters And Combination Number For The Binding Of HCPT With Ce6 Obtained From The Analysis Of Isothermal Titration Calorimetry At 298.15 K
Figure 1 Isothermal titration calorimetry profiles for the binding of HCPT with Ce6 in buffer (50 mM Tris containing 20% DMF) at 298.15 K. The upper panel represents the raw data for the titration of HCPT into Ce6 solution. The bottom panel represents the integrated heat data obtained from the raw data after deducting the heat of dilution, in which the solid square and solid line panel indicate the experimental data and the best curve fitting to the experimental data, respectively.
Abbreviations: HCPT, 10-hydroxycamptothecine; Ce6, Chlorin e6.
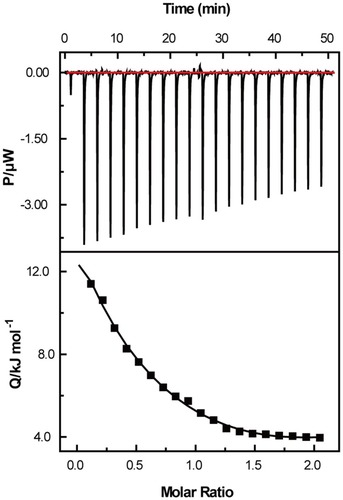
Figure 2 Molecular dynamics simulations for HCPT and Ce6 molecules.
Notes: (A) Two types of molecules initially arranged apart in water. (B) The self-assembly of HCPT molecules in water after 10 ns. (C) The co-assembly of HCPT with Ce6 molecules in water after 40 ns. The software was VMD.
Abbreviations: HCPT, 10-hydroxycamptothecine; Ce6, Chlorin e6; ns, nanosecond.
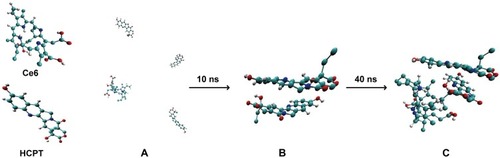
Table 2 Results Of HCPT/Ce6 NRs Prepared Via Different Drug/Molar Ratio Of HCPT To Ce6
Figure 3 Characterization of dual-functional HCPT/Ce6 nanorods.
Notes: Distribution of (A) particle size and (B) zeta potential; stability of (C) particle size and (D) zeta potential as a function of time (0 to 21 days) in purified water. Dh, mean hydrodynamic diameter.
Abbreviations: ZP, zeta potential; HCPT, 10-hydroxycamptothecine; Ce6, Chlorin e6; PDI, poly-dispersity index.
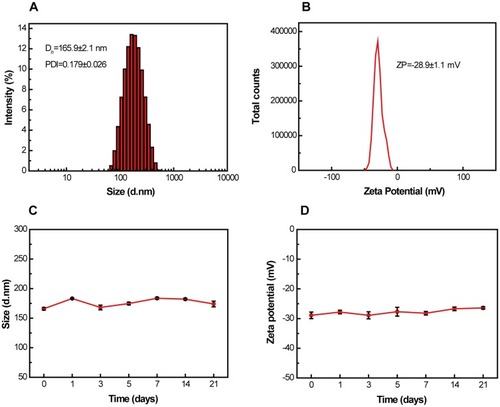
Figure 4 TEM images of (A) HCPT/Ce6 NRs (molar ratio HCPT: Ce6=3:1). SEM images of (B) HCPT/Ce6 NRs, (C) free HCPT powder and (D) free Ce6 powder. Scale bar: 200 nm.
Abbreviations: HCPT, 10-hydroxycamptothecine; Ce6, Chlorin e6; NRs, nanorods; TEM, transmission electron microscope; SEM, scanning electron microscope.
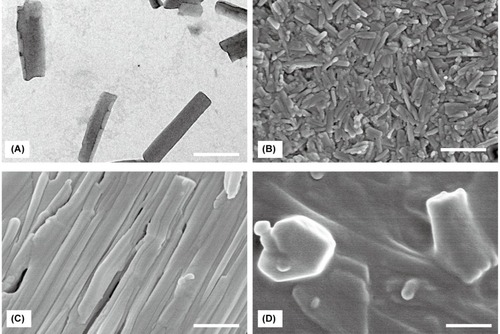
Figure 5 (A) FT-IR spectra and (B) XRD patterns of (a) raw Ce6, (b) raw HCPT, (c) physical mixture of HCPT and Ce6, and (d) HCPT/Ce6 nanorods.
Abbreviations: HCPT, 10-hydroxycamptothecine; Ce6, Chlorin e6; FT-IR, fourier-transform infrared; XRD, powder X-ray diffraction
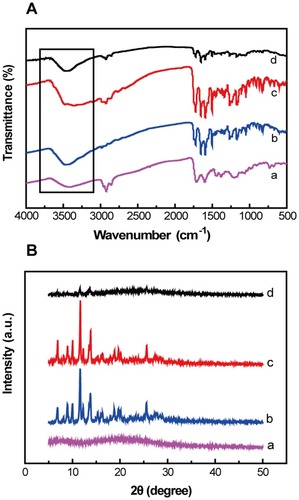
Figure 6 (A) The in vitro cumulative drug release curves of HCPT and Ce6 from NRs and injection. (B) Fluorescence intensity variation of SOSG-EP (Ex=498nm, Em=525.8 nm) via a fluorescence spectrophotometer at the characteristic peak against the irradiation time. (C) In vitro cell viability of 4T1 cells after incubation with various formulations with or without laser irradiation (λ=660 nm, 5 mW, 2 mins). (D) Intracellular ROS level evaluation using DCFH-DA. Fluorescence microscope images of 4T1 cells after incubation with different formulations followed with or without laser irradiation (λ=660 nm, 5 mW, 5 mins). Scale bar: 100 μm.
Abbreviations: HCPT, 10-hydroxycamptothecine; Ce6, Chlorin e6; NRs, nanorods; Inj., injection; L, laser; PBS, phosphate buffer saline.
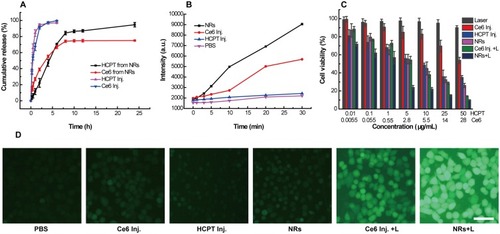
Figure 7 Intracellular uptake of HCPT/Ce6 NRs in 4T1 cells assessed by HPLC-FLD system.
Notes: (A) The cellular uptake content of HCPT in 0.5, 1.5, 3, and 5 hrs. (B) The cellular uptake content of HCPT in 5, 10, 25, and 50 μg/mL. (C) The cellular uptake content of HCPT after incubated with diverse endocytosis inhibitor Methyl-β-cyclodextrin (MβCD), Cytochalasin D (CCD) and Sucrose. (D) Fluorescence microscope images of 4T1 cells after incubation with HCPT/Ce6 NRs (equal to 10 μg/mL Ce6) for 4 hrs. Ce6 (red fluorescence), Hoechst (blue fluorescence), and LysoTracker® Green (green fluorescence) were observed and represented NRs, nuclei, and lysosome, respectively. Scale bar: 100 μm.
Abbreviations: HCPT, 10-hydroxycamptothecine; Ce6, Chlorin e6; NRs, nanorods; BF, bright field; Hoechst, Hoechst 33258; LysoTracker, LysoTracker® Green.
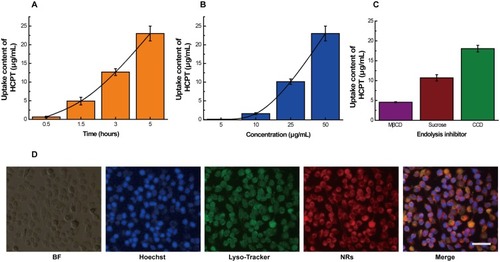
Figure 8 (A) Suppression of tumor growth after various treatments: intravenous injection of different formulations with or without laser irradiation (n=6). *p < 0.05, NRs versus NRs+L; **p < 0.01, Ce6 Inj.+L, HCPT Inj. or HCPT+Ce6 Inj.+L versus NRs+L; ***P < 0.001, saline versus NRs+L. (B) Body weight changes of tumor-bearing mice during the treatment (n=6). (C) Tumor inhibition rate (TIR%) based on the average tumor weights in each group (n=6). *p < 0.05, NRs versus NRs+L; **p < 0.01, Ce6 Inj.+L, HCPT Inj. or HCPT+Ce6 Inj.+L versus NRs+L. (D) Images of the excised 4T1 tumor tissues after various treatments at 10 days post implantation. (a) Saline; (b) HCPT Inj.; (c) Ce6 Inj.+L; (d) HCPT+Ce6 Inj.+L; (e) NRs; (f) NRs+L. (E) Hematoxylin and eosin (H&E) stained histological images of tumor tissues from different groups of 4T1 tumor-bearing mice after treated with various formulations. Scale bar: 100 μm.
Abbreviations: Inj., injection; L, laser; NRs, nanorods; HCPT, 10-hydroxycamptothecine; Ce6, Chlorin e6.
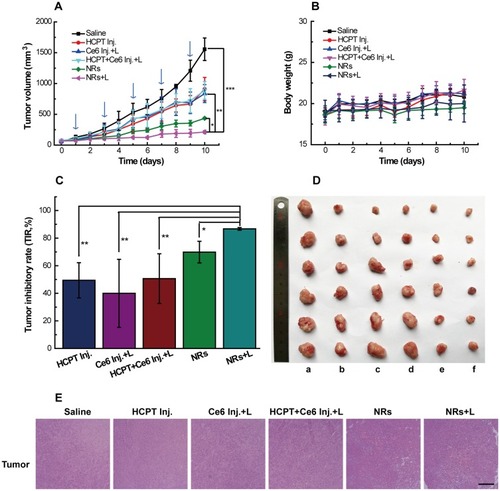
Table 3 Plasma Biochemical Levels Of 4T1 Bearing BALB/c Mice After Treatment With Different Formulations
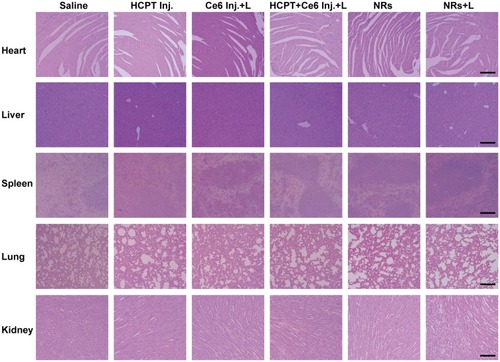
Figure 9 H&E stained histological images obtained from main organs (heart, liver, spleen, lung, and kidney) of 4T1 tumor-bearing mice after treated with various formulations. Scale bar: 100 μm.
Abbreviations: Inj., injection; L, laser; NRs, nanorods; HCPT, 10-hydroxycamptothecine; Ce6, Chlorin e6.